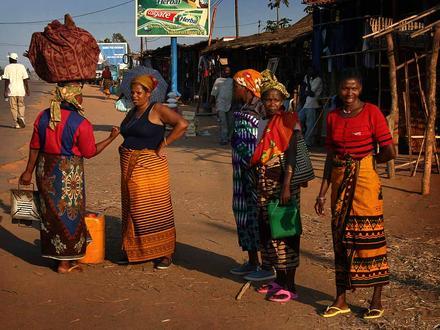
Commerces à Moma
| Agglomération de Moma, Province de Nampula | 2 513,5 km² |
| Population | 220 778 |
| Population masculine | 110 630 (50,1 %) |
| Population féminine | 110 148 (49,9 %) |
| Changement de la population entre 1975 et 2015 | +185,1 % |
| Changement de la population entre 2000 et 2015 | +46,6 % |
| Age moyen | 15,8 |
| Age masculin moyen | 15,3 |
| Age féminin moyen | 16,4 |
| Codes Téléphone | 26 |
| Heure locale | vendredi 18:10 |
| Fuseau horaire | heure normale d’Afrique centrale |
| Lat. et long. | -16.75944° / 39.22222° |
Moma, Province de Nampula - Carte
Population de Moma, Province de Nampula
Période allant de 1975 à 2015| Les données | 1975 | 1990 | 2000 | 2015 |
|---|---|---|---|---|
| Population | 77 430 | 108 366 | 150 601 | 220 778 |
| Densité de population | 30,8 / km² | 43,1 / km² | 59,9 / km² | 87,8 / km² |
Changement de la population de 2000 à 2015 à Moma
Augmentation de 46,6 % à partir de 2000 jusqu'en 2015| Lieu | Changement depuis 1975 | Changement depuis 1990 | Changement depuis 2000 |
|---|---|---|---|
| Moma, Province de Nampula | +185,1 % | +103,7 % | +46,6 % |
| Province de Nampula | +193,7 % | +117,1 % | +55,2 % |
| Mozambique | +173,4 % | +111,3 % | +53,8 % |
Âge médian de Moma, Province de Nampula
Âge médian : 15,8 ans| Lieu | Age moyen | Âge médian (femme) | Âge médian (masculin) |
|---|---|---|---|
| Moma, Province de Nampula | 15,8 ans | 16,4 ans | 15,3 ans |
| Province de Nampula | 16,3 ans | 16,5 ans | 16 ans |
| Mozambique | 16,7 ans | 17,5 ans | 15,8 ans |
Arbre démographique de Moma, Province de Nampula
Population par âge et sexe| Âge | Homme | Femme | Total |
|---|---|---|---|
| Moins de 5 ans | 21 344 | 21 555 | 42 900 |
| 5-9 | 19 852 | 19 353 | 39 206 |
| 10-14 | 13 550 | 11 348 | 24 898 |
| 15-19 | 9 056 | 9 930 | 18 987 |
| 20-24 | 6 844 | 9 074 | 15 919 |
| 25-29 | 7 135 | 9 078 | 16 213 |
| 30-34 | 6 954 | 7 379 | 14 333 |
| 35-39 | 6 839 | 6 752 | 13 591 |
| 40-44 | 4 676 | 3 837 | 8 513 |
| 45-49 | 4 003 | 3 361 | 7 364 |
| 50-54 | 2 648 | 2 856 | 5 504 |
| 55-59 | 2 232 | 1 762 | 3 995 |
| 60-64 | 1 744 | 1 363 | 3 108 |
| 65-69 | 1 370 | 926 | 2 296 |
| 70-74 | 845 | 631 | 1 476 |
| 75-79 | 671 | 363 | 1 034 |
| 80-84 | 296 | 278 | 574 |
| 85 Plus | 571 | 304 | 876 |
Densité de la population de Moma, Province de Nampula
Densité de la population : 87,8 / km²| Lieu | Population | Région | Densité de population |
|---|---|---|---|
| Moma, Province de Nampula | 220 778 | 2 513,5 km² | 87,8 / km² |
| Province de Nampula | 5,3 millions | 78 175,1 km² | 68,3 / km² |
| Mozambique | 27,5 millions | 786 431,3 km² | 34,9 / km² |
Moma, Province de Nampula : Population historique et projetée
Estimation de la population de 1200 à 2100Sources:
1. JRC (European Commission's Joint Research Centre) work on the GHS built-up grid
2. CIESIN (Center for International Earth Science Information Network)
3. [Lien] Klein Goldewijk, K., Beusen, A., Doelman, J., and Stehfest, E.: Anthropogenic land use estimates for the Holocene – HYDE 3.2, Earth Syst. Sci. Data, 9, 927–953, https://doi.org/10.5194/essd-9-927-2017, 2017.
Indice de développement humain (IDH)
Indice composite statistique de l'espérance de vie, de l'éducation et du revenu par habitant.Sources: [Link] Kummu, M., Taka, M. & Guillaume, J. Gridded global datasets for Gross Domestic Product and Human Development Index over 1990–2015. Sci Data 5, 180004 (2018) doi:10.1038/sdata.2018.4
Émissions de CO2 à Moma, Province de Nampula
Émissions de dioxyde de carbone (CO2) par habitant en tonnes par an| Lieu | Emissions de CO2 | Émissions de CO2 par habitant | Intensité des émissions de CO2 |
|---|---|---|---|
| Moma, Province de Nampula | 42 436 sh tn | 0,19 sh tn | 16,9 sh tn/km² |
| Province de Nampula | 1 048 653 sh tn | 0,2 sh tn | 13,4 sh tn/km² |
| Mozambique | 5 734 289 sh tn | 0,21 sh tn | 7,29 sh tn/km² |
Émissions de CO2 à Moma, Province de Nampula
| Émissions de CO2 (tonnes/an) en 2013 | 42 436 sh tn |
| Émissions de CO2 (tonnes/an) par habitant en 2013 | 0,19 sh tn |
| Intensité des émissions de CO2 (tonnes/km²/an) pour l'année 2013 | 16,9 sh tn/km² |
Risque de dangers naturels
Risque relatif sur 10| Cyclone | Élevé (9) |
| Sécheresse | Élevé (7) |
| Inonder | Moyen (4) |
* Les risques, en particulier concernant les inondations ou les glissements de terrain, peuvent ne pas concerner toute la zone.
Sources: 1. Dilley, M., R.S. Chen, U. Deichmann, A.L. Lerner-Lam, M. Arnold, J. Agwe, P. Buys, O. Kjekstad, B. Lyon, and G. Yetman. 2005. Natural Disaster Hotspots: A Global Risk Analysis. Washington, D.C.: World Bank. https://doi.org/10.1596/0-8213-5930-4.
2. Center for Hazards and Risk Research - CHRR - Columbia University, Center for International Earth Science Information Network - CIESIN - Columbia University, and International Research Institute for Climate and Society - IRI - Columbia University. 2005. Global Drought Hazard Frequency and Distribution. Palisades, NY: NASA Socioeconomic Data and Applications Center (SEDAC). https://doi.org/10.7927/H4VX0DFT.
3. Center for Hazards and Risk Research - CHRR - Columbia University, Center for International Earth Science Information Network - CIESIN - Columbia University, International Bank for Reconstruction and Development - The World Bank, and United Nations Environment Programme Global Resource Information Database Geneva - UNEP/GRID-Geneva. 2005. Global Cyclone Hazard Frequency and Distribution. Palisades, NY: NASA Socioeconomic Data and Applications Center (SEDAC). https://doi.org/10.7927/H4CZ353K.
4. Center for Hazards and Risk Research - CHRR - Columbia University, Center for International Earth Science Information Network - CIESIN - Columbia University. 2005. Global Flood Hazard Frequency and Distribution. Palisades, NY: NASA Socioeconomic Data and Applications Center (SEDAC). https://doi.org/10.7927/H4668B3D.
Tremblements de terre récents à proximité
Magnitude 3.0 et plus| Date | Heure | Ordre de grandeur | Distance | Profondeur | Lieu | Lien |
|---|---|---|---|---|---|---|
| 15/06/2002 | 20:00 | 4,1 | 70,7 km | 10 000 m | Mozambique | usgs.gov |

À propos de nos données
Les données de cette page sont estimées à l'aide d'un certain nombre d'outils et de ressources accessibles au public. Il est fourni sans garantie et peut contenir des inexactitudes. À utiliser à vos risques et périls. Voir ici pour plus d'informations.