Commerces à Gondelour
Hôtels & Voyage
Restaurants
Automobile
Services financiers
Médical
Beauté & Spas
Organisme communautaire et gouvernemental
les industries
Répartition des entreprises par industrie Shopping: 28,8 %
Religion: 9 %
Secteur: 7,6 %
Nourriture: 7,3 %
Éducation: 5,6 %
Services professionnels: 5,4 %
Hôtels & Voyage: 5,1 %
Autre: 31,1 %
| Description de l'industrie | Nombre d'établissements | Évaluation Google moyenne | Entreprises pour 1 000 habitants |
|---|---|---|---|
| Administration publique | 44 | 3.8 | 0,2 |
| Activités d’enseignement secondaire | 32 | 4.0 | 0,2 |
| Education supérieure (collèges et universités) | 58 | 3.9 | 0,3 |
| Banques | 49 | 3.6 | 0,2 |
| Sociétés de Prêt | 51 | 3.6 | 0,3 |
| Épiceries et supermarchés | 29 | 3.9 | 0,1 |
| Agences de Voyage | 28 | 4.2 | 0,1 |
| Autres activités d’hébergement | 42 | 3.7 | 0,2 |
| Hôpitaux | 74 | 3.7 | 0,4 |
| Santé et médecine | 60 | 4.0 | 0,3 |
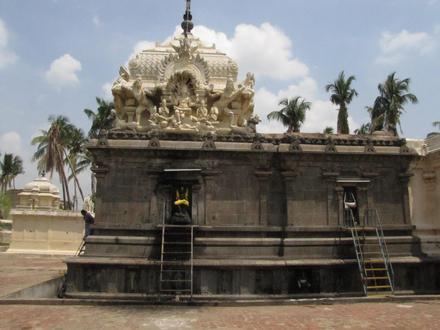
| Temples hindous | 53 | 4.5 | 0,3 |
| Bijouterie | 25 | 4.0 | 0,1 |
| Boutiques d'appareils électroniques | 29 | 4.2 | 0,1 |
| Boutiques de Mariage | 22 | 3.7 | 0,1 |
| Boutiques de vêtements | 24 | 4.0 | 0,1 |
| Grands Magasins | 34 | 3.8 | 0,2 |
| Quincailleries | 24 | 4.5 | 0,1 |
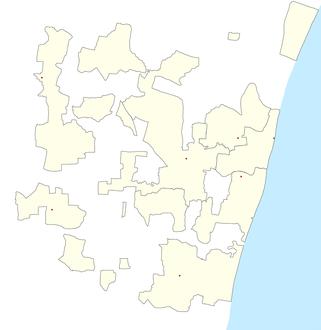
| Agglomération de Gondelour, Tamil Nadu | 27,3 km² |
| Population | 196 763 |
| Population masculine | 98 187 (49,9 %) |
| Population féminine | 98 576 (50,1 %) |
| Changement de la population entre 1975 et 2015 | +86,5 % |
| Changement de la population entre 2000 et 2015 | +9,2 % |
| Age moyen | 28,7 |
| Age masculin moyen | 28,4 |
| Age féminin moyen | 28,9 |
| Codes Téléphone | 4142 |
| Voisinages | Allpettai, Manjakuppam, Manjakuppam, Muthaiya Nagar, Thirupapuliyur, Pudupalayam, Semmandalam, Thirupapuliyur |
| Heure locale | vendredi 20:52 |
| Fuseau horaire | heure de l’Inde |
| Lat. et long. | 11.74629° / 79.76436° |
| Codes Postaux | 605007, 605106, 607001, 607002, 607003, Plus |
Gondelour, Tamil Nadu - Carte
Population de Gondelour, Tamil Nadu
Période allant de 1975 à 2015| Les données | 1975 | 1990 | 2000 | 2015 |
|---|---|---|---|---|
| Population | 105 498 | 159 024 | 180 243 | 196 763 |
| Densité de population | 3 871 / km² | 5 835 / km² | 6 613 / km² | 7 220 / km² |
Changement de la population de 2000 à 2015 à Gondelour
Augmentation de 9,2 % à partir de 2000 jusqu'en 2015| Lieu | Changement depuis 1975 | Changement depuis 1990 | Changement depuis 2000 |
|---|---|---|---|
| Gondelour, Tamil Nadu | +86,5 % | +23,7 % | +9,2 % |
| Tamil Nadu | +98,5 % | +44,5 % | +21,3 % |
| Inde | +111,1 % | +50,6 % | +24,5 % |
Âge médian de Gondelour, Tamil Nadu
Âge médian : 28,7 ans| Lieu | Age moyen | Âge médian (femme) | Âge médian (masculin) |
|---|---|---|---|
| Gondelour, Tamil Nadu | 28,7 ans | 28,9 ans | 28,4 ans |
| Tamil Nadu | 29,8 ans | 30,1 ans | 29,5 ans |
| Inde | 24,9 ans | 25,4 ans | 24,5 ans |
Arbre démographique de Gondelour, Tamil Nadu
Population par âge et sexe| Âge | Homme | Femme | Total |
|---|---|---|---|
| Moins de 5 ans | 7 876 | 7 118 | 14 994 |
| 5-9 | 8 297 | 7 848 | 16 146 |
| 10-14 | 9 051 | 8 773 | 17 825 |
| 15-19 | 9 169 | 8 927 | 18 096 |
| 20-24 | 8 737 | 9 121 | 17 858 |
| 25-29 | 8 711 | 9 515 | 18 227 |
| 30-34 | 7 617 | 7 780 | 15 398 |
| 35-39 | 7 483 | 8 491 | 15 974 |
| 40-44 | 6 832 | 6 861 | 13 693 |
| 45-49 | 6 444 | 6 310 | 12 754 |
| 50-54 | 5 007 | 4 746 | 9 754 |
| 55-59 | 3 951 | 3 869 | 7 820 |
| 60-64 | 3 378 | 3 493 | 6 872 |
| 65-69 | 2 167 | 2 348 | 4 516 |
| 70-74 | 1 747 | 1 720 | 3 468 |
| 75-79 | 862 | 786 | 1 649 |
| 80-84 | 527 | 527 | 1 054 |
| 85 Plus | 329 | 345 | 675 |
Densité de la population de Gondelour, Tamil Nadu
Densité de la population : 7 220 / km²| Lieu | Population | Région | Densité de population |
|---|---|---|---|
| Gondelour, Tamil Nadu | 196 763 | 27,3 km² | 7 220 / km² |
| Tamil Nadu | 77,2 millions | 129 941,8 km² | 594,2 / km² |
| Inde | 1,3 milliards | 3 083 563,4 km² | 423,8 / km² |
Gondelour, Tamil Nadu : Population historique et projetée
Estimation de la population ancienne jusqu'en 2100Sources:
1. JRC (European Commission's Joint Research Centre) work on the GHS built-up grid
2. CIESIN (Center for International Earth Science Information Network)
3. [Lien] Klein Goldewijk, K., Beusen, A., Doelman, J., and Stehfest, E.: Anthropogenic land use estimates for the Holocene – HYDE 3.2, Earth Syst. Sci. Data, 9, 927–953, https://doi.org/10.5194/essd-9-927-2017, 2017.
Voisinages
Répartition des activités par quartier en Gondelour Thirupapuliyur: 14,9 %
Manjakuppam: 13,1 %
Muthaiya Nagar, Thirupapuliyur: 9,8 %
Pudupalayam: 5,5 %
Autre: 56,6 %
Répartition des activités par prix pour Gondelour, Tamil Nadu
Bon marché: 44,4 %
Modéré : 44,4 %
Cher : 11,1 %
Indice de développement humain (IDH)
Indice composite statistique de l'espérance de vie, de l'éducation et du revenu par habitant.Sources: [Link] Kummu, M., Taka, M. & Guillaume, J. Gridded global datasets for Gross Domestic Product and Human Development Index over 1990–2015. Sci Data 5, 180004 (2018) doi:10.1038/sdata.2018.4
Émissions de CO2 à Gondelour, Tamil Nadu
Émissions de dioxyde de carbone (CO2) par habitant en tonnes par an| Lieu | Emissions de CO2 | Émissions de CO2 par habitant | Intensité des émissions de CO2 |
|---|---|---|---|
| Gondelour, Tamil Nadu | 312 196 sh tn | 1,59 sh tn | 11 455 sh tn/km² |
| Tamil Nadu | 137 005 612 sh tn | 1,77 sh tn | 1 054 sh tn/km² |
| Inde | 1 928 568 344 sh tn | 1,48 sh tn | 625,4 sh tn/km² |
Émissions de CO2 à Gondelour, Tamil Nadu
| Émissions de CO2 (tonnes/an) en 2013 | 312 196 sh tn |
| Émissions de CO2 (tonnes/an) par habitant en 2013 | 1,59 sh tn |
| Intensité des émissions de CO2 (tonnes/km²/an) pour l'année 2013 | 11 455 sh tn/km² |
Risque de dangers naturels
Risque relatif sur 10| Cyclone | Élevé (7) |
| Inonder | Élevé (7) |
* Les risques, en particulier concernant les inondations ou les glissements de terrain, peuvent ne pas concerner toute la zone.
Sources: 1. Dilley, M., R.S. Chen, U. Deichmann, A.L. Lerner-Lam, M. Arnold, J. Agwe, P. Buys, O. Kjekstad, B. Lyon, and G. Yetman. 2005. Natural Disaster Hotspots: A Global Risk Analysis. Washington, D.C.: World Bank. https://doi.org/10.1596/0-8213-5930-4.
2. Center for Hazards and Risk Research - CHRR - Columbia University, Center for International Earth Science Information Network - CIESIN - Columbia University. 2005. Global Flood Hazard Frequency and Distribution. Palisades, NY: NASA Socioeconomic Data and Applications Center (SEDAC). https://doi.org/10.7927/H4668B3D.
3. Center for Hazards and Risk Research - CHRR - Columbia University, Center for International Earth Science Information Network - CIESIN - Columbia University, International Bank for Reconstruction and Development - The World Bank, and United Nations Environment Programme Global Resource Information Database Geneva - UNEP/GRID-Geneva. 2005. Global Cyclone Hazard Frequency and Distribution. Palisades, NY: NASA Socioeconomic Data and Applications Center (SEDAC). https://doi.org/10.7927/H4CZ353K.
Tremblements de terre récents à proximité
Magnitude 3.0 et plus| Date | Heure | Ordre de grandeur | Distance | Profondeur | Lieu | Lien |
|---|---|---|---|---|---|---|
| 25/09/2001 | 07:56 | 5,2 | 54,2 km | 10 000 m | near the coast of Tamil Nadu, India | usgs.gov |

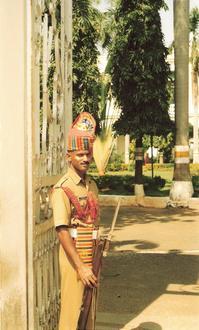
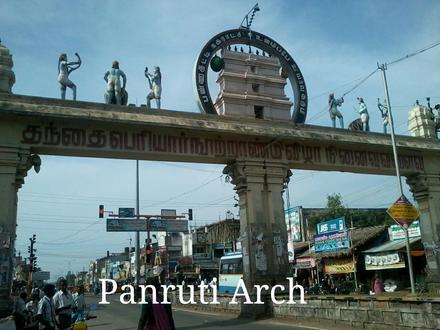
Gondelour, Tamil Nadu
ou Cuddalore (en anglais) et கடலூர் (en tamoul), est une cité industrielle de l'État du Tamil Nadu, dans le sud de l'Inde. Située sur la côte de Coromandel, au sud de Pondichéry, elle est le chef-lieu du district de Gondelour. nom français Gondelour (ou Gou.. Page Wikipédia de Gondelour
Codes Postaux
Pourcentage d'entreprises par Codes Postaux à Gondelour Code Postal 607001: 45,4 %
Code Postal 607002: 26,6 %
Autre: 28 %
À propos de nos données
Les données de cette page sont estimées à l'aide d'un certain nombre d'outils et de ressources accessibles au public. Il est fourni sans garantie et peut contenir des inexactitudes. À utiliser à vos risques et périls. Voir ici pour plus d'informations.