Commerces à Baheri
Hôtels & Voyage
Restaurants
Automobile
Services financiers
Médical
Beauté & Spas
Organisme communautaire et gouvernemental
les industries
Répartition des entreprises par industrie Shopping: 33,9 %
Nourriture: 13 %
Éducation: 7,6 %
Religion: 6,5 %
Secteur: 6,2 %
Restaurants: 5,4 %
Autre: 27,4 %
| Description de l'industrie | Nombre d'établissements | Évaluation Google moyenne | Entreprises pour 1 000 habitants |
|---|---|---|---|
| Education supérieure (collèges et universités) | 10 | 4.1 | 0,0 |
| Hôpitaux | 5 | 3.9 | 0,0 |
| Mosquées | 10 | 4.4 | 0,0 |
| Boutiques de vêtements | 6 | 4.4 | 0,0 |
| Grands Magasins | 6 | 3.5 | 0,0 |
| Pharmacies | 5 | 4.4 | 0,0 |
| Agglomération de Baheri, Uttar Pradesh | 801,5 km² |
| Population | 435 507 |
| Population masculine | 229 109 (52,6 %) |
| Population féminine | 206 399 (47,4 %) |
| Changement de la population entre 1975 et 2015 | +166,7 % |
| Changement de la population entre 2000 et 2015 | +37,7 % |
| Age moyen | 20 |
| Age masculin moyen | 19,9 |
| Age féminin moyen | 20,1 |
| Codes Téléphone | 5822, 7133 |
| Voisinages | Baheri Bazar, Bazar Moholla, punjabi colony |
| Heure locale | dimanche 11:29 |
| Fuseau horaire | heure de l’Inde |
| Lat. et long. | 28.77416° / 79.4974° |
| Codes Postaux | 243201 |
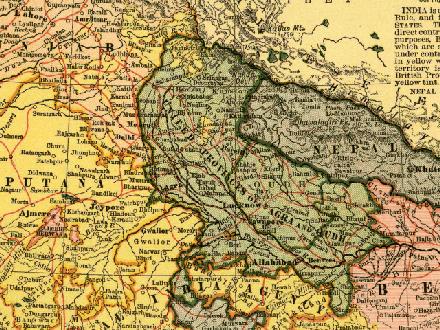
Baheri, Uttar Pradesh - Carte
Population de Baheri, Uttar Pradesh
Période allant de 1975 à 2015| Les données | 1975 | 1990 | 2000 | 2015 |
|---|---|---|---|---|
| Population | 163 288 | 223 057 | 316 276 | 435 507 |
| Densité de population | 203,7 / km² | 278,3 / km² | 394,6 / km² | 543,4 / km² |
Changement de la population de 2000 à 2015 à Baheri
Augmentation de 37,7 % à partir de 2000 jusqu'en 2015| Lieu | Changement depuis 1975 | Changement depuis 1990 | Changement depuis 2000 |
|---|---|---|---|
| Baheri, Uttar Pradesh | +166,7 % | +95,2 % | +37,7 % |
| Uttar Pradesh | +134,1 % | +59,5 % | +28,4 % |
| Inde | +111,1 % | +50,6 % | +24,5 % |
Âge médian de Baheri, Uttar Pradesh
Âge médian : 20 ans| Lieu | Age moyen | Âge médian (femme) | Âge médian (masculin) |
|---|---|---|---|
| Baheri, Uttar Pradesh | 20 ans | 20,1 ans | 19,9 ans |
| Uttar Pradesh | 21,3 ans | 21,7 ans | 21 ans |
| Inde | 24,9 ans | 25,4 ans | 24,5 ans |
Arbre démographique de Baheri, Uttar Pradesh
Population par âge et sexe| Âge | Homme | Femme | Total |
|---|---|---|---|
| Moins de 5 ans | 24 364 | 22 527 | 46 891 |
| 5-9 | 29 560 | 26 459 | 56 020 |
| 10-14 | 31 661 | 28 329 | 59 991 |
| 15-19 | 29 302 | 25 470 | 54 772 |
| 20-24 | 21 713 | 18 070 | 39 783 |
| 25-29 | 16 228 | 15 094 | 31 323 |
| 30-34 | 14 144 | 13 822 | 27 967 |
| 35-39 | 14 294 | 13 334 | 27 629 |
| 40-44 | 12 185 | 10 239 | 22 425 |
| 45-49 | 9 189 | 8 075 | 17 264 |
| 50-54 | 7 167 | 5 817 | 12 984 |
| 55-59 | 5 022 | 5 627 | 10 650 |
| 60-64 | 5 982 | 5 475 | 11 457 |
| 65-69 | 3 452 | 3 273 | 6 725 |
| 70-74 | 2 371 | 2 116 | 4 488 |
| 75-79 | 816 | 857 | 1 673 |
| 80-84 | 638 | 711 | 1 350 |
| 85 Plus | 1 022 | 1 102 | 2 124 |
Densité de la population de Baheri, Uttar Pradesh
Densité de la population : 543,4 / km²| Lieu | Population | Région | Densité de population |
|---|---|---|---|
| Baheri, Uttar Pradesh | 435 507 | 801,5 km² | 543,4 / km² |
| Uttar Pradesh | 217,8 millions | 240 777,3 km² | 904,6 / km² |
| Inde | 1,3 milliards | 3 083 563,4 km² | 423,8 / km² |
Baheri, Uttar Pradesh : Population historique et projetée
Estimation de la population ancienne jusqu'en 2100Sources:
1. JRC (European Commission's Joint Research Centre) work on the GHS built-up grid
2. CIESIN (Center for International Earth Science Information Network)
3. [Lien] Klein Goldewijk, K., Beusen, A., Doelman, J., and Stehfest, E.: Anthropogenic land use estimates for the Holocene – HYDE 3.2, Earth Syst. Sci. Data, 9, 927–953, https://doi.org/10.5194/essd-9-927-2017, 2017.
Voisinages
Répartition des activités par quartier en Baheri Baheri Bazar: 67,5 %
Bazar Moholla: 15 %
punjabi colony: 6,2 %
Autre: 11,3 %
Codes de zone
Pourcentage des indicatifs régionaux utilisés par les entreprises de Baheri Code du Téléphone 80: 17,5 %
Code du Téléphone 5822: 15 %
Code du Téléphone 79: 7,5 %
Code du Téléphone 8252: 7,5 %
Code du Téléphone 8869: 7,5 %
Code du Téléphone 6272: 5 %
Autre: 40 %
Indice de développement humain (IDH)
Indice composite statistique de l'espérance de vie, de l'éducation et du revenu par habitant.Sources: [Link] Kummu, M., Taka, M. & Guillaume, J. Gridded global datasets for Gross Domestic Product and Human Development Index over 1990–2015. Sci Data 5, 180004 (2018) doi:10.1038/sdata.2018.4
Émissions de CO2 à Baheri, Uttar Pradesh
Émissions de dioxyde de carbone (CO2) par habitant en tonnes par an| Lieu | Emissions de CO2 | Émissions de CO2 par habitant | Intensité des émissions de CO2 |
|---|---|---|---|
| Baheri, Uttar Pradesh | 553 427 sh tn | 1,27 sh tn | 690,5 sh tn/km² |
| Uttar Pradesh | 259 048 938 sh tn | 1,19 sh tn | 1 075 sh tn/km² |
| Inde | 1 928 568 344 sh tn | 1,48 sh tn | 625,4 sh tn/km² |
Émissions de CO2 à Baheri, Uttar Pradesh
| Émissions de CO2 (tonnes/an) en 2013 | 553 427 sh tn |
| Émissions de CO2 (tonnes/an) par habitant en 2013 | 1,27 sh tn |
| Intensité des émissions de CO2 (tonnes/km²/an) pour l'année 2013 | 690,5 sh tn/km² |
Risque de dangers naturels
Risque relatif sur 10| Sécheresse | Élevé (8) |
| Inonder | Élevé (9) |
| Tremblement de terre | Moyen (4,9) |
* Les risques, en particulier concernant les inondations ou les glissements de terrain, peuvent ne pas concerner toute la zone.
Sources: 1. Dilley, M., R.S. Chen, U. Deichmann, A.L. Lerner-Lam, M. Arnold, J. Agwe, P. Buys, O. Kjekstad, B. Lyon, and G. Yetman. 2005. Natural Disaster Hotspots: A Global Risk Analysis. Washington, D.C.: World Bank. https://doi.org/10.1596/0-8213-5930-4.
2. Center for Hazards and Risk Research - CHRR - Columbia University, Center for International Earth Science Information Network - CIESIN - Columbia University, and International Research Institute for Climate and Society - IRI - Columbia University. 2005. Global Drought Hazard Frequency and Distribution. Palisades, NY: NASA Socioeconomic Data and Applications Center (SEDAC). https://doi.org/10.7927/H4VX0DFT.
3. Center for Hazards and Risk Research - CHRR - Columbia University, Center for International Earth Science Information Network - CIESIN - Columbia University. 2005. Global Earthquake Hazard Distribution - Peak Ground Acceleration. Palisades, NY: NASA Socioeconomic Data and Applications Center (SEDAC). https://doi.org/10.7927/H4BZ63ZS.
4. Center for Hazards and Risk Research - CHRR - Columbia University, Center for International Earth Science Information Network - CIESIN - Columbia University. 2005. Global Flood Hazard Frequency and Distribution. Palisades, NY: NASA Socioeconomic Data and Applications Center (SEDAC). https://doi.org/10.7927/H4668B3D.
Tremblements de terre récents à proximité
Magnitude 3.0 et plus| Date | Heure | Ordre de grandeur | Distance | Profondeur | Lieu | Lien |
|---|---|---|---|---|---|---|
| 22/03/1999 | 23:29 | 3,7 | 86,7 km | 33 000 m | Uttar Pradesh, India | usgs.gov |
| 26/07/1992 | 16:31 | 3,5 | 75,8 km | 33 000 m | Nepal-India border region | usgs.gov |
| 27/10/1991 | 05:19 | 3,9 | 91,5 km | 33 000 m | Uttaranchal, India | usgs.gov |
| 10/06/1991 | 14:30 | 4,6 | 93,8 km | 58 100 m | Nepal-India border region | usgs.gov |
| 14/08/1966 | 19:15 | 5,6 | 57,3 km | 27 000 m | Uttar Pradesh, India | usgs.gov |
Codes Postaux
Pourcentage d'entreprises par Codes Postaux à Baheri Code Postal 243201: 65,8 %
Code Postal 847105: 25,5 %
Autre: 8,7 %
À propos de nos données
Les données de cette page sont estimées à l'aide d'un certain nombre d'outils et de ressources accessibles au public. Il est fourni sans garantie et peut contenir des inexactitudes. À utiliser à vos risques et périls. Voir ici pour plus d'informations.