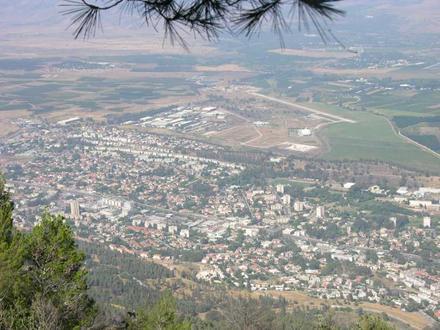
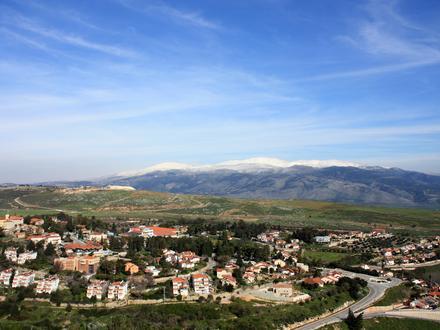
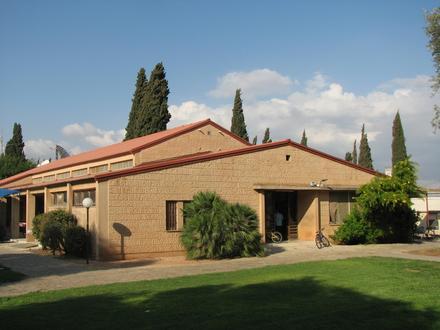
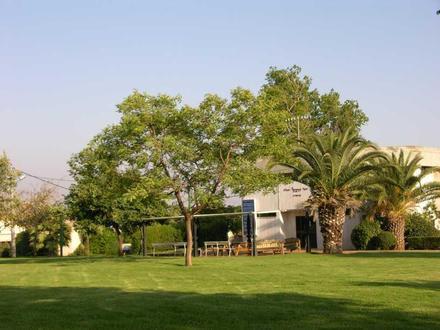
Commerces à Misgav ‘Am
| Agglomération de Misgav ‘Am, District nord (Israël) | 0,265 km² |
| Population | 244 |
| Population masculine | 124 (51 %) |
| Population féminine | 120 (49 %) |
| Changement de la population entre 1975 et 2015 | +234,2 % |
| Changement de la population entre 2000 et 2015 | +61,6 % |
| Age moyen | 28,2 |
| Age masculin moyen | 29,6 |
| Age féminin moyen | 26,8 |
| Codes Téléphone | 4 |
| Heure locale | vendredi 18:18 |
| Fuseau horaire | heure d’été d’Israël |
| Profil Facebook | |
| Lat. et long. | 33.24744° / 35.54891° |
| Codes Postaux | 12155 |
Misgav ‘Am, District nord (Israël) - Carte
Population de Misgav ‘Am, District nord (Israël)
Période allant de 1975 à 2015| Les données | 1975 | 1990 | 2000 | 2015 |
|---|---|---|---|---|
| Population | 73 | 127 | 151 | 244 |
| Densité de population | 275,6 / km² | 479,5 / km² | 570,2 / km² | 921,3 / km² |
Changement de la population de 2000 à 2015 à Misgav ‘Am
Augmentation de 61,6 % à partir de 2000 jusqu'en 2015| Lieu | Changement depuis 1975 | Changement depuis 1990 | Changement depuis 2000 |
|---|---|---|---|
| Misgav ‘Am, District nord (Israël) | +234,2 % | +92,1 % | +61,6 % |
| District nord | +142,6 % | +78,8 % | +33,6 % |
| Israël | +141,5 % | +78,8 % | +33,8 % |
Âge médian de Misgav ‘Am, District nord (Israël)
Âge médian : 28,2 ans| Lieu | Age moyen | Âge médian (femme) | Âge médian (masculin) |
|---|---|---|---|
| Misgav ‘Am, District nord (Israël) | 28,2 ans | 26,8 ans | 29,6 ans |
| District nord | 26,9 ans | 27,7 ans | 26,2 ans |
| Israël | 29,6 ans | 30,6 ans | 28,5 ans |
Arbre démographique de Misgav ‘Am, District nord (Israël)
Population par âge et sexe| Âge | Homme | Femme | Total |
|---|---|---|---|
| Moins de 5 ans | 8 | 8 | 16 |
| 5-9 | 10 | 10 | 20 |
| 10-14 | 11 | 12 | 24 |
| 15-19 | 12 | 13 | 26 |
| 20-24 | 11 | 13 | 25 |
| 25-29 | 11 | 12 | 23 |
| 30-34 | 9 | 9 | 19 |
| 35-39 | 8 | 7 | 16 |
| 40-44 | 9 | 7 | 16 |
| 45-49 | 9 | 6 | 16 |
| 50-54 | 7 | 6 | 13 |
| 55-59 | 5 | 5 | 11 |
| 60-64 | 5 | 4 | 9 |
| 65-69 | 4 | 3 | 8 |
| 70-74 | 3 | 3 | 7 |
| 75-79 | 2 | 2 | 5 |
| 80-84 | 0 | 0 | 0 |
| 85 Plus | 0 | 0 | 0 |
Densité de la population de Misgav ‘Am, District nord (Israël)
Densité de la population : 921,3 / km²| Lieu | Population | Région | Densité de population |
|---|---|---|---|
| Misgav ‘Am, District nord (Israël) | 244 | 0,265 km² | 921,3 / km² |
| District nord | 1,4 millions | 4 641,2 km² | 303,9 / km² |
| Israël | 8,3 millions | 22 078 km² | 374,2 / km² |
Misgav ‘Am, District nord (Israël) : Population historique et projetée
Estimation de la population ancienne jusqu'en 2100Sources:
1. JRC (European Commission's Joint Research Centre) work on the GHS built-up grid
2. CIESIN (Center for International Earth Science Information Network)
3. [Lien] Klein Goldewijk, K., Beusen, A., Doelman, J., and Stehfest, E.: Anthropogenic land use estimates for the Holocene – HYDE 3.2, Earth Syst. Sci. Data, 9, 927–953, https://doi.org/10.5194/essd-9-927-2017, 2017.
Indice de développement humain (IDH)
Indice composite statistique de l'espérance de vie, de l'éducation et du revenu par habitant.Sources: [Link] Kummu, M., Taka, M. & Guillaume, J. Gridded global datasets for Gross Domestic Product and Human Development Index over 1990–2015. Sci Data 5, 180004 (2018) doi:10.1038/sdata.2018.4
Émissions de CO2 à Misgav ‘Am, District nord (Israël)
Émissions de dioxyde de carbone (CO2) par habitant en tonnes par an| Lieu | Emissions de CO2 | Émissions de CO2 par habitant | Intensité des émissions de CO2 |
|---|---|---|---|
| Misgav ‘Am, District nord (Israël) | 1 389 sh tn | 5,69 sh tn | 5 246 sh tn/km² |
| District nord | 11 734 869 sh tn | 8,32 sh tn | 2 528 sh tn/km² |
| Israël | 81 985 470 sh tn | 9,92 sh tn | 3 713 sh tn/km² |
Émissions de CO2 à Misgav ‘Am, District nord (Israël)
| Émissions de CO2 (tonnes/an) en 2013 | 1 389 sh tn |
| Émissions de CO2 (tonnes/an) par habitant en 2013 | 5,69 sh tn |
| Intensité des émissions de CO2 (tonnes/km²/an) pour l'année 2013 | 5 246 sh tn/km² |
Risque de dangers naturels
Risque relatif sur 10| Sécheresse | Élevé (9) |
| Inonder | Élevé (7) |
| Tremblement de terre | Élevé (7) |
* Les risques, en particulier concernant les inondations ou les glissements de terrain, peuvent ne pas concerner toute la zone.
Sources: 1. Dilley, M., R.S. Chen, U. Deichmann, A.L. Lerner-Lam, M. Arnold, J. Agwe, P. Buys, O. Kjekstad, B. Lyon, and G. Yetman. 2005. Natural Disaster Hotspots: A Global Risk Analysis. Washington, D.C.: World Bank. https://doi.org/10.1596/0-8213-5930-4.
2. Center for Hazards and Risk Research - CHRR - Columbia University, Center for International Earth Science Information Network - CIESIN - Columbia University, and International Research Institute for Climate and Society - IRI - Columbia University. 2005. Global Drought Hazard Frequency and Distribution. Palisades, NY: NASA Socioeconomic Data and Applications Center (SEDAC). https://doi.org/10.7927/H4VX0DFT.
3. Center for Hazards and Risk Research - CHRR - Columbia University, Center for International Earth Science Information Network - CIESIN - Columbia University. 2005. Global Earthquake Hazard Distribution - Peak Ground Acceleration. Palisades, NY: NASA Socioeconomic Data and Applications Center (SEDAC). https://doi.org/10.7927/H4BZ63ZS.
4. Center for Hazards and Risk Research - CHRR - Columbia University, Center for International Earth Science Information Network - CIESIN - Columbia University. 2005. Global Flood Hazard Frequency and Distribution. Palisades, NY: NASA Socioeconomic Data and Applications Center (SEDAC). https://doi.org/10.7927/H4668B3D.
Tremblements de terre récents à proximité
Magnitude 3.0 et plus| Date | Heure | Ordre de grandeur | Distance | Profondeur | Lieu | Lien |
|---|---|---|---|---|---|---|
| 03/11/2018 | 10:42 | 3,8 | 76,1 km | 32 140 m | 44km WNW of Sidon, Lebanon | usgs.gov |
| 04/07/2018 | 12:45 | 4,7 | 50,9 km | 10 000 m | 5km SE of 'Eilabun, Israel | usgs.gov |
| 03/07/2018 | 18:50 | 4 | 52,2 km | 10 000 m | 6km SSE of 'Eilabun, Israel | usgs.gov |
| 29/06/2016 | 06:24 | 3,7 | 64,6 km | 13 850 m | 19km WSW of Beirut, Lebanon | usgs.gov |
| 01/09/2014 | 13:50 | 4,4 | 80,8 km | 10 000 m | 4km S of Sirghaya, Syria | usgs.gov |
| 05/07/2014 | 14:41 | 4 | 40,2 km | 12 700 m | 3km NE of Sidon, Lebanon | usgs.gov |
| 20/10/2013 | 05:54 | 3,5 | 43,4 km | 5 000 m | 8km NNE of Tiberias, Israel | usgs.gov |
| 10/07/2009 | 11:19 | 4 | 19,8 km | 10 000 m | Lebanon - Syria region | usgs.gov |
| 02/07/2008 | 02:29 | 3,1 | 19,7 km | 20 100 m | Lebanon - Syria region | usgs.gov |
| 12/06/2008 | 22:28 | 4 | 12,2 km | 1 000 m | Lebanon - Syria region | usgs.gov |
Trouvez des occurrences de séisme historiques près de Misgav ‘Am, District nord (Israël)
Date la plus ancienne La date la plus récente
Magnitude 3.0 et plus Magnitude 4.0 et plus Magnitude 5,0 et plus
À propos de nos données
Les données de cette page sont estimées à l'aide d'un certain nombre d'outils et de ressources accessibles au public. Il est fourni sans garantie et peut contenir des inexactitudes. À utiliser à vos risques et périls. Voir ici pour plus d'informations.