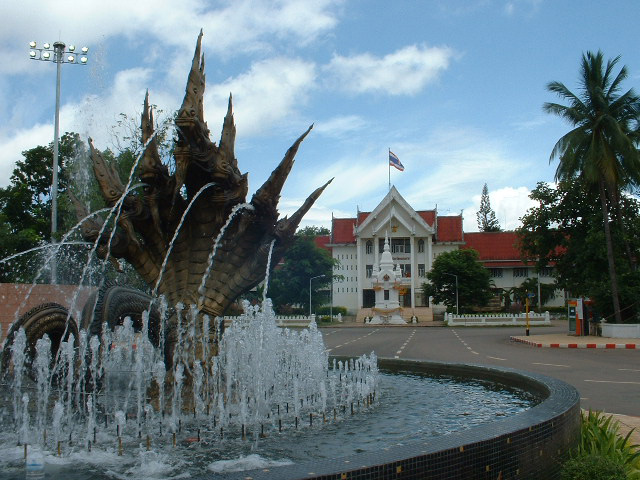
Catégories à Phon Phisai
les industries
Répartition des entreprises par secteur à Phon Phisai
| Description de l'industrie | Nombre d'établissements | Évaluation Google moyenne |
|---|---|---|
| Restaurants | 9 | 4.3 |
| Magasins de fournitures de bureau et papeteries | 7 | — |
| Restaurants thaïlandais | 6 | — |
Faits sur Phon Phisai
| Région | 6.3 km² |
| Population | 1 080 |
| Population masculine | 529 (49.0%) |
| Population féminine | 551 (51.0%) |
| Variation de la population (1975 to 2020) | +18.8% |
| Variation de la population (2000 to 2020) | +14.2% |
| Age moyen | 34.7 ans (Hommes : 33.8, Femmes : 35.7) |
| Voisinages | โพนพิสัย, Tambon Chumphon, Thonburi, Nong Kom Ko, Tambon Na Nang |
| Heure locale | |
| Fuseau horaire | heure d’Indochine |
| Lat. et long. | 18.02106, 103.07664 |
Carte de Phon Phisai
Carte interactive
Population de Phon Phisai
Années 1975 à 2020
| Data | 1975 | 1990 | 2000 | 2015 | 2020 |
|---|---|---|---|---|---|
| Population | 909 | 706 | 946 | 1 054 | 1 080 |
| Densité de population | 144 / km² | 111,8 / km² | 149,9 / km² | 167 / km² | 171,1 / km² |
Variation de la population de Phon Phisai de 2000 à 2015
Augmentation de 11.4% de l'année 2000 à 2015
| Lieu | Variation depuis 1975 | Variation depuis 1990 | Variation depuis 2000 |
|---|---|---|---|
| Phon Phisai | +16% | +49.3% | +11.4% |
| Province de Nong Khai | +119.3% | +131.5% | +13.1% |
| Thaïlande | +60.4% | +20.1% | +8.3% |
Âge médian de Phon Phisai
Âge médian : 34.7 ans
| Lieu | Age moyen | Âge médian (femme) | Âge médian (masculin) |
|---|---|---|---|
| Phon Phisai | 34.7 yrs | 35.7 yrs | 33.8 yrs |
| Province de Nong Khai | 34.7 yrs | 35.6 yrs | 33.8 yrs |
| Thaïlande | 35.2 yrs | 36 yrs | 34.3 yrs |
Densité de population de Phon Phisai
Densité de population : 171 / km²
| Lieu | Population | Région | Densité |
|---|---|---|---|
| Phon Phisai | 1 080 | 6,3 km² | 171 / km² |
| Province de Nong Khai | 3 077 | 2,648 km² | 1 162 / km² |
| Thaïlande | 67,6 million | 514 961,7 km² | 131 / km² |
Population historique et projetée de Phon Phisai
Population estimée de 1400 à 2100
- JRC (European Commission's Joint Research Centre) travailler sur GHS built-up grid
- CIESIN (Center for International Earth Science Information Network)
- [Lien] Klein Goldewijk, K., Beusen, A., Doelman, J., and Stehfest, E.: Anthropogenic land use estimates for the Holocene – HYDE 3.2, Earth Syst. Sci. Data, 9, 927–953, https://doi.org/10.5194/essd-9-927-2017, 2017.
Quartiers à Phon Phisai
Pourcentage d'entreprises par quartier à Phon Phisai
Distribution des prix
Répartition des activités par prix pour Phon Phisai
Indice de développement humain (IDH)
Indice composite statistique de l'espérance de vie, de l'éducation et du revenu par habitant.
Émissions de CO2 de Phon Phisai
Émissions de dioxyde de carbone (CO2) par habitant en tonnes par an
| Lieu | Emissions de CO2 | Émissions de CO2 par habitant | Intensité des émissions de CO2 |
|---|---|---|---|
| Phon Phisai | 4,118 tn | 3.81 tn | 652.3 tons/km² |
| Province de Nong Khai | 12,254 tn | 3.98 tn | 4,626.7 tons/km² |
| Thaïlande | 278,589,420 tn | 4.12 tn | 541 tons/km² |
| Émissions de CO2 en 2013 (tonnes/an) | 4,118 tn |
| Émissions de CO2 en 2013 (tonnes/an) par habitant | 3.81 tn |
| Intensité des émissions de CO2 en 2013 (tonnes/km²/an) | 652.3 tons/km² |
Risque de dangers naturels
Relative risk out of 10
| Danger | Risk Level |
|---|---|
| Drought | Low (2) |
| Earthquake | Low (2) |
| Cyclone | High (8) |
* Risk, particularly concerning flood or landslide, may not be for the entire area.
- Dilley, M., R.S. Chen, U. Deichmann, A.L. Lerner-Lam, M. Arnold, J. Agwe, P. Buys, O. Kjekstad, B. Lyon, and G. Yetman. 2005. Natural Disaster Hotspots: A Global Risk Analysis. Washington, D.C.: World Bank. https://doi.org/10.1596/0-8213-5930-4.
- Center for Hazards and Risk Research - CHRR - Columbia University, Center for International Earth Science Information Network - CIESIN - Columbia University, International Bank for Reconstruction and Development - The World Bank, and United Nations Environment Programme Global Resource Information Database Geneva - UNEP/GRID-Geneva. 2005. Global Cyclone Hazard Frequency and Distribution. Palisades, NY: NASA Socioeconomic Data and Applications Center (SEDAC). https://doi.org/10.7927/H4CZ353K.
- Center for Hazards and Risk Research - CHRR - Columbia University, Center for International Earth Science Information Network - CIESIN - Columbia University, and International Research Institute for Climate and Society - IRI - Columbia University. 2005. Global Drought Hazard Frequency and Distribution. Palisades, NY: NASA Socioeconomic Data and Applications Center (SEDAC). https://doi.org/10.7927/H4VX0DFT.
- Center for Hazards and Risk Research - CHRR - Columbia University, Center for International Earth Science Information Network - CIESIN - Columbia University. 2005. Global Earthquake Hazard Distribution - Peak Ground Acceleration. Palisades, NY: NASA Socioeconomic Data and Applications Center (SEDAC). https://doi.org/10.7927/H4BZ63ZS.

À propos de nos données
Les données de cette page sont estimées à l'aide de divers outils et ressources accessibles au public. Elles sont fournies sans garantie et peuvent contenir des inexactitudes. Utilisez-les à vos risques et périls.