Catégories à Itahari
les industries
Répartition des entreprises par secteur à Itahari
| Description de l'industrie | Nombre d'établissements |
|---|---|
| Éducation | 33 |
| Shopping | 33 |
| Voyages et transports | 26 |
| Restaurants | 22 |
| Magasin de bricolage | 18 |
| Épiceries et supermarchés | 17 |
| Appartements | 14 |
| Boutiques d'appareils électroniques | 13 |
| Hôtels et motels | 13 |
| Tracteurs et Machinisme Agricole | 12 |
| Vente en gros de matériaux de construction | 12 |
| Temple hindou | 12 |
Faits sur Itahari
| Région | 38.5 km² |
| Population | 122 465 |
| Population masculine | 58 229 (47.5%) |
| Population féminine | 64 236 (52.5%) |
| Variation de la population (1975 to 2020) | +1530712.5% |
| Variation de la population (2000 to 2020) | +1165.7% |
| Age moyen | 24.1 ans (Hommes : 23.1, Femmes : 24.8) |
| PIB par habitant (PPA) | $5 163 (2022) |
| Codes Téléphone | 25 |
| Heure locale | |
| Fuseau horaire | heure du Népal |
| Lat. et long. | 26.66667, 87.28333 |
| Codes Postaux | 56705 |
Carte de Itahari
Carte interactive
Population de Itahari
Années 1975 à 2030
| Data | 1975 | 1990 | 2000 | 2015 | 2020 | 2025* | 2030* |
|---|---|---|---|---|---|---|---|
| Population | 8 | 825 | 9 676 | 164 365 | 122 465 | 154 972 | 182 420 |
| Densité de population | 0,2 / km² | 21,4 / km² | 251,3 / km² | 4 269,2 / km² | 3 180,9 / km² | 4 025,2 / km² | 4 738,2 / km² |
Variation de la population de Itahari de 2000 à 2020
Augmentation de 1165.7% de l'année 2000 à 2020
| Lieu | Variation depuis 1975 | Variation depuis 1990 | Variation depuis 2000 |
|---|---|---|---|
| Itahari | +1530712.5% | +14744.2% | +1165.7% |
| Népal | — | — | — |
Âge médian de Itahari
Âge médian : 24.1 ans
| Lieu | Age moyen | Âge médian (femme) | Âge médian (masculin) |
|---|---|---|---|
| Itahari | 24.1 yrs | 24.8 yrs | 23.1 yrs |
| Népal | 21.7 yrs | 22.6 yrs | 20.4 yrs |
Densité de population de Itahari
Densité de population : 3 181 / km²
| Lieu | Population | Région | Densité |
|---|---|---|---|
| Itahari | 122 465 | 38,5 km² | 3 181 / km² |
| Népal | 28,7 million | 147 926,4 km² | 194 / km² |
Population historique et projetée de Itahari
Population estimée de 1975 à 2100
- JRC (European Commission's Joint Research Centre) travailler sur GHS built-up grid
- CIESIN (Center for International Earth Science Information Network)
- [Lien] Klein Goldewijk, K., Beusen, A., Doelman, J., and Stehfest, E.: Anthropogenic land use estimates for the Holocene – HYDE 3.2, Earth Syst. Sci. Data, 9, 927–953, https://doi.org/10.5194/essd-9-927-2017, 2017.
Indice de développement humain (IDH)
Indice composite statistique de l'espérance de vie, de l'éducation et du revenu par habitant.
Produit intérieur brut (PIB) de Itahari
PIB par habitant, PPA (dollars internationaux constants de 2017)
| Data | 1990 | 1995 | 2000 | 2005 | 2010 | 2015 | 2020 | 2022 |
|---|---|---|---|---|---|---|---|---|
| PIB par habitant | $1 330 | $1 402 | $1 430 | $2 731 | $3 575 | $4 234 | $4 875 | $5 163 |
| PIB total | $14,7 M | $18,4 M | $22,2 M | $47,7 M | $69,8 M | $92,6 M | $116,3 M | $131,3 M |
Émissions de CO2 de Itahari
Émissions de dioxyde de carbone (CO2) par habitant en tonnes par an
| Lieu | Emissions de CO2 | Émissions de CO2 par habitant | Intensité des émissions de CO2 |
|---|---|---|---|
| Itahari | 42,094 tn | 0.34 tn | 1,093.4 tons/km² |
| Népal | 11,136,221 tn | 0.39 tn | 75.3 tons/km² |
| Émissions de CO2 en 2013 (tonnes/an) | 42,094 tn |
| Émissions de CO2 en 2013 (tonnes/an) par habitant | 0.34 tn |
| Intensité des émissions de CO2 en 2013 (tonnes/km²/an) | 1,093.4 tons/km² |
Risque de dangers naturels
Risque relatif sur 10
| Danger | Niveau de risque |
|---|---|
| Sécheresse | Moyen (5) |
| Inonder | Élevé (10) |
| Tremblement de terre | Élevé (7.3) |
* Les risques, en particulier concernant les inondations ou les glissements de terrain, peuvent ne pas concerner toute la zone.
- Dilley, M., R.S. Chen, U. Deichmann, A.L. Lerner-Lam, M. Arnold, J. Agwe, P. Buys, O. Kjekstad, B. Lyon, and G. Yetman. 2005. Natural Disaster Hotspots: A Global Risk Analysis. Washington, D.C.: World Bank. https://doi.org/10.1596/0-8213-5930-4.
- Center for Hazards and Risk Research - CHRR - Columbia University, Center for International Earth Science Information Network - CIESIN - Columbia University, and International Research Institute for Climate and Society - IRI - Columbia University. 2005. Global Drought Hazard Frequency and Distribution. Palisades, NY: NASA Socioeconomic Data and Applications Center (SEDAC). https://doi.org/10.7927/H4VX0DFT.
- Center for Hazards and Risk Research - CHRR - Columbia University, Center for International Earth Science Information Network - CIESIN - Columbia University. 2005. Global Flood Hazard Frequency and Distribution. Palisades, NY: NASA Socioeconomic Data and Applications Center (SEDAC). https://doi.org/10.7927/H4668B3D.
- Center for Hazards and Risk Research - CHRR - Columbia University, Center for International Earth Science Information Network - CIESIN - Columbia University. 2005. Global Earthquake Hazard Distribution - Peak Ground Acceleration. Palisades, NY: NASA Socioeconomic Data and Applications Center (SEDAC). https://doi.org/10.7927/H4BZ63ZS.
Tremblements de terre récents à proximité
Magnitude 3.0 et plus
| Date▼ | Heure↕ | Magnitude↕ | Distance↕ | Profondeur↕ | Lieu↕ | Lien |
|---|---|---|---|---|---|---|
| 1/22/19 | 4:45 PM | 4.3 | 74.8 km | 10,000 m | 15km NW of Bhojpur, Nepal | usgs.gov |
| 6/20/18 | 4:15 AM | 4.4 | 75.2 km | 52,910 m | 29km NNW of Ilam, Nepal | usgs.gov |
| 6/20/18 | 4:08 AM | 4.4 | 39.6 km | 38,300 m | 17km E of Dhankuta, Nepal | usgs.gov |
| 8/15/15 | 5:42 AM | 4.4 | 97 km | 10,000 m | 48km WNW of Naya Bazar, India | usgs.gov |
| 4/27/15 | 12:35 PM | 5.1 | 79.8 km | 31,710 m | 13km ESE of Ilam, Nepal | usgs.gov |
| 4/19/13 | 6:35 AM | 4.2 | 93 km | 47,100 m | 46km WNW of Naya Bazar, India | usgs.gov |
| 3/27/12 | 11:40 PM | 5 | 80.9 km | 28,800 m | Nepal-India border region | usgs.gov |
| 2/13/11 | 5:51 PM | 4.5 | 86.8 km | 28,600 m | Nepal | usgs.gov |
| 8/11/07 | 2:35 PM | 5 | 87.5 km | 35,000 m | Nepal | usgs.gov |
| 8/3/07 | 3:50 AM | 4.3 | 68.2 km | 64,000 m | Nepal | usgs.gov |
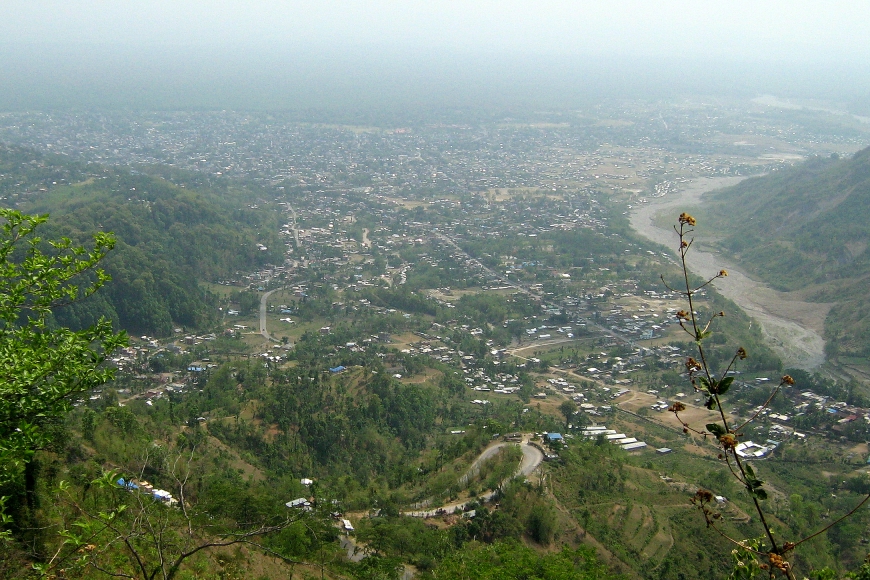
Itahari
Itahari (népalais : इटहरी) est une ville du Népal située dans la zone de Koshi et dans le district de Sunsari. Au recensement de 2011, la ville comptait 74 501 habitants.
Page Wikipédia de Itahari

À propos de nos données
Les données de cette page sont estimées à l'aide de divers outils et ressources accessibles au public. Elles sont fournies sans garantie et peuvent contenir des inexactitudes. Utilisez-les à vos risques et périls.