Catégories à Myingyan
les industries
Répartition des entreprises par secteur à Myingyan
| Description de l'industrie | Nombre d'établissements |
|---|---|
| Restaurants | 74 |
| Shopping | 73 |
| Religion | 49 |
| Boutiques de vêtements | 43 |
| Éducation | 38 |
| Cafés | 37 |
| Boutiques d'appareils électroniques | 25 |
| Temple bouddhiste | 23 |
| Station service | 21 |
| Autres activités d’hébergement | 17 |
Faits sur Myingyan
| Région | 6.9 km² |
| Population | 85 516 |
| Population masculine | 38 438 (44.9%) |
| Population féminine | 47 078 (55.1%) |
| Variation de la population (1975 to 2020) | +756.0% |
| Variation de la population (2000 to 2020) | +5.4% |
| Age moyen | 30.1 ans (Hommes : 28.2, Femmes : 31.5) |
| Codes Téléphone | 66 |
| Heure locale | |
| Fuseau horaire | heure du Myanmar |
| Lat. et long. | 21.46002, 95.38840 |
Carte de Myingyan
Carte interactive
Population de Myingyan
Années 1975 à 2030
| Data | 1975 | 1990 | 2000 | 2015 | 2020 | 2025* | 2030* |
|---|---|---|---|---|---|---|---|
| Population | 9 990 | 54 148 | 81 123 | 84 103 | 85 516 | 83 523 | 80 806 |
| Densité de population | 1 453,1 / km² | 7 876,1 / km² | 11 799,7 / km² | 12 233,2 / km² | 12 438,7 / km² | 12 148,8 / km² | 11 753,6 / km² |
Variation de la population de Myingyan de 2000 à 2020
Augmentation de 5.4% de l'année 2000 à 2020
| Lieu | Variation depuis 1975 | Variation depuis 1990 | Variation depuis 2000 |
|---|---|---|---|
| Myingyan | +756% | +57.9% | +5.4% |
| Région de Mandalay | — | — | — |
| Birmanie | — | — | — |
Âge médian de Myingyan
Âge médian : 30.1 ans
| Lieu | Age moyen | Âge médian (femme) | Âge médian (masculin) |
|---|---|---|---|
| Myingyan | 30.1 yrs | 31.5 yrs | 28.2 yrs |
| Région de Mandalay | 28.2 yrs | 29.5 yrs | 26.8 yrs |
| Birmanie | 27.2 yrs | 28.2 yrs | 26.1 yrs |
Densité de population de Myingyan
Densité de population : 12 439 / km²
| Lieu | Population | Région | Densité |
|---|---|---|---|
| Myingyan | 85 516 | 6,9 km² | 12 439 / km² |
| Région de Mandalay | 6,6 million | 30 955,3 km² | 213 / km² |
| Birmanie | 53,1 million | 668 905 km² | 79,4 / km² |
Population historique et projetée de Myingyan
Population estimée de 1870 à 2100
- JRC (European Commission's Joint Research Centre) travailler sur GHS built-up grid
- CIESIN (Center for International Earth Science Information Network)
- [Lien] Klein Goldewijk, K., Beusen, A., Doelman, J., and Stehfest, E.: Anthropogenic land use estimates for the Holocene – HYDE 3.2, Earth Syst. Sci. Data, 9, 927–953, https://doi.org/10.5194/essd-9-927-2017, 2017.
Codes Téléphone
Pourcentage des indicatifs régionaux utilisés par les entreprises de Myingyan
Indice de développement humain (IDH)
Indice composite statistique de l'espérance de vie, de l'éducation et du revenu par habitant.
Émissions de CO2 de Myingyan
Émissions de dioxyde de carbone (CO2) par habitant en tonnes par an
| Lieu | Emissions de CO2 | Émissions de CO2 par habitant | Intensité des émissions de CO2 |
|---|---|---|---|
| Myingyan | 23,855 tn | 0.28 tn | 3,469.8 tons/km² |
| Région de Mandalay | 1,748,349 tn | 0.27 tn | 56.5 tons/km² |
| Birmanie | 11,664,181 tn | 0.22 tn | 17.4 tons/km² |
| Émissions de CO2 en 2013 (tonnes/an) | 23,855 tn |
| Émissions de CO2 en 2013 (tonnes/an) par habitant | 0.28 tn |
| Intensité des émissions de CO2 en 2013 (tonnes/km²/an) | 3,469.8 tons/km² |
Risque de dangers naturels
Risque relatif sur 10
| Danger | Niveau de risque |
|---|---|
| Sécheresse | Élevé (8) |
| Inonder | Moyen (4) |
| Tremblement de terre | Élevé (8) |
* Les risques, en particulier concernant les inondations ou les glissements de terrain, peuvent ne pas concerner toute la zone.
- Dilley, M., R.S. Chen, U. Deichmann, A.L. Lerner-Lam, M. Arnold, J. Agwe, P. Buys, O. Kjekstad, B. Lyon, and G. Yetman. 2005. Natural Disaster Hotspots: A Global Risk Analysis. Washington, D.C.: World Bank. https://doi.org/10.1596/0-8213-5930-4.
- Center for Hazards and Risk Research - CHRR - Columbia University, Center for International Earth Science Information Network - CIESIN - Columbia University, and International Research Institute for Climate and Society - IRI - Columbia University. 2005. Global Drought Hazard Frequency and Distribution. Palisades, NY: NASA Socioeconomic Data and Applications Center (SEDAC). https://doi.org/10.7927/H4VX0DFT.
- Center for Hazards and Risk Research - CHRR - Columbia University, Center for International Earth Science Information Network - CIESIN - Columbia University. 2005. Global Flood Hazard Frequency and Distribution. Palisades, NY: NASA Socioeconomic Data and Applications Center (SEDAC). https://doi.org/10.7927/H4668B3D.
- Center for Hazards and Risk Research - CHRR - Columbia University, Center for International Earth Science Information Network - CIESIN - Columbia University. 2005. Global Earthquake Hazard Distribution - Peak Ground Acceleration. Palisades, NY: NASA Socioeconomic Data and Applications Center (SEDAC). https://doi.org/10.7927/H4BZ63ZS.
Tremblements de terre récents à proximité
Magnitude 3.0 et plus
| Date▼ | Heure↕ | Magnitude↕ | Distance↕ | Profondeur↕ | Lieu↕ | Lien |
|---|---|---|---|---|---|---|
| 6/26/18 | 12:02 AM | 4.6 | 90.7 km | 21,810 m | 14km NW of Monywa, Burma | usgs.gov |
| 4/27/18 | 3:18 AM | 4.3 | 70.6 km | 124,720 m | 44km SW of Monywa, Burma | usgs.gov |
| 3/24/18 | 6:41 PM | 4.2 | 72.5 km | 118,820 m | 51km SW of Monywa, Burma | usgs.gov |
| 11/4/17 | 8:29 PM | 4.3 | 46.5 km | 34,870 m | 41km W of Sagaing, Burma | usgs.gov |
| 10/2/17 | 6:13 PM | 4.6 | 87.8 km | 95,120 m | 59km WNW of Pakokku, Burma | usgs.gov |
| 9/17/17 | 9:49 PM | 4.5 | 87.4 km | 97,030 m | 65km NW of Pakokku, Burma | usgs.gov |
| 8/24/16 | 10:57 AM | 4.5 | 94.9 km | 93,150 m | 16km WNW of Chauk, Burma | usgs.gov |
| 8/1/16 | 10:01 AM | 5.1 | 50.3 km | 131,470 m | 17km W of Pakokku, Burma | usgs.gov |
| 7/27/16 | 4:20 AM | 4.9 | 85 km | 96,840 m | 58km WNW of Pakokku, Burma | usgs.gov |
| 3/7/16 | 3:13 AM | 4.6 | 65.2 km | 100,990 m | 24km ENE of Chauk, Burma | usgs.gov |
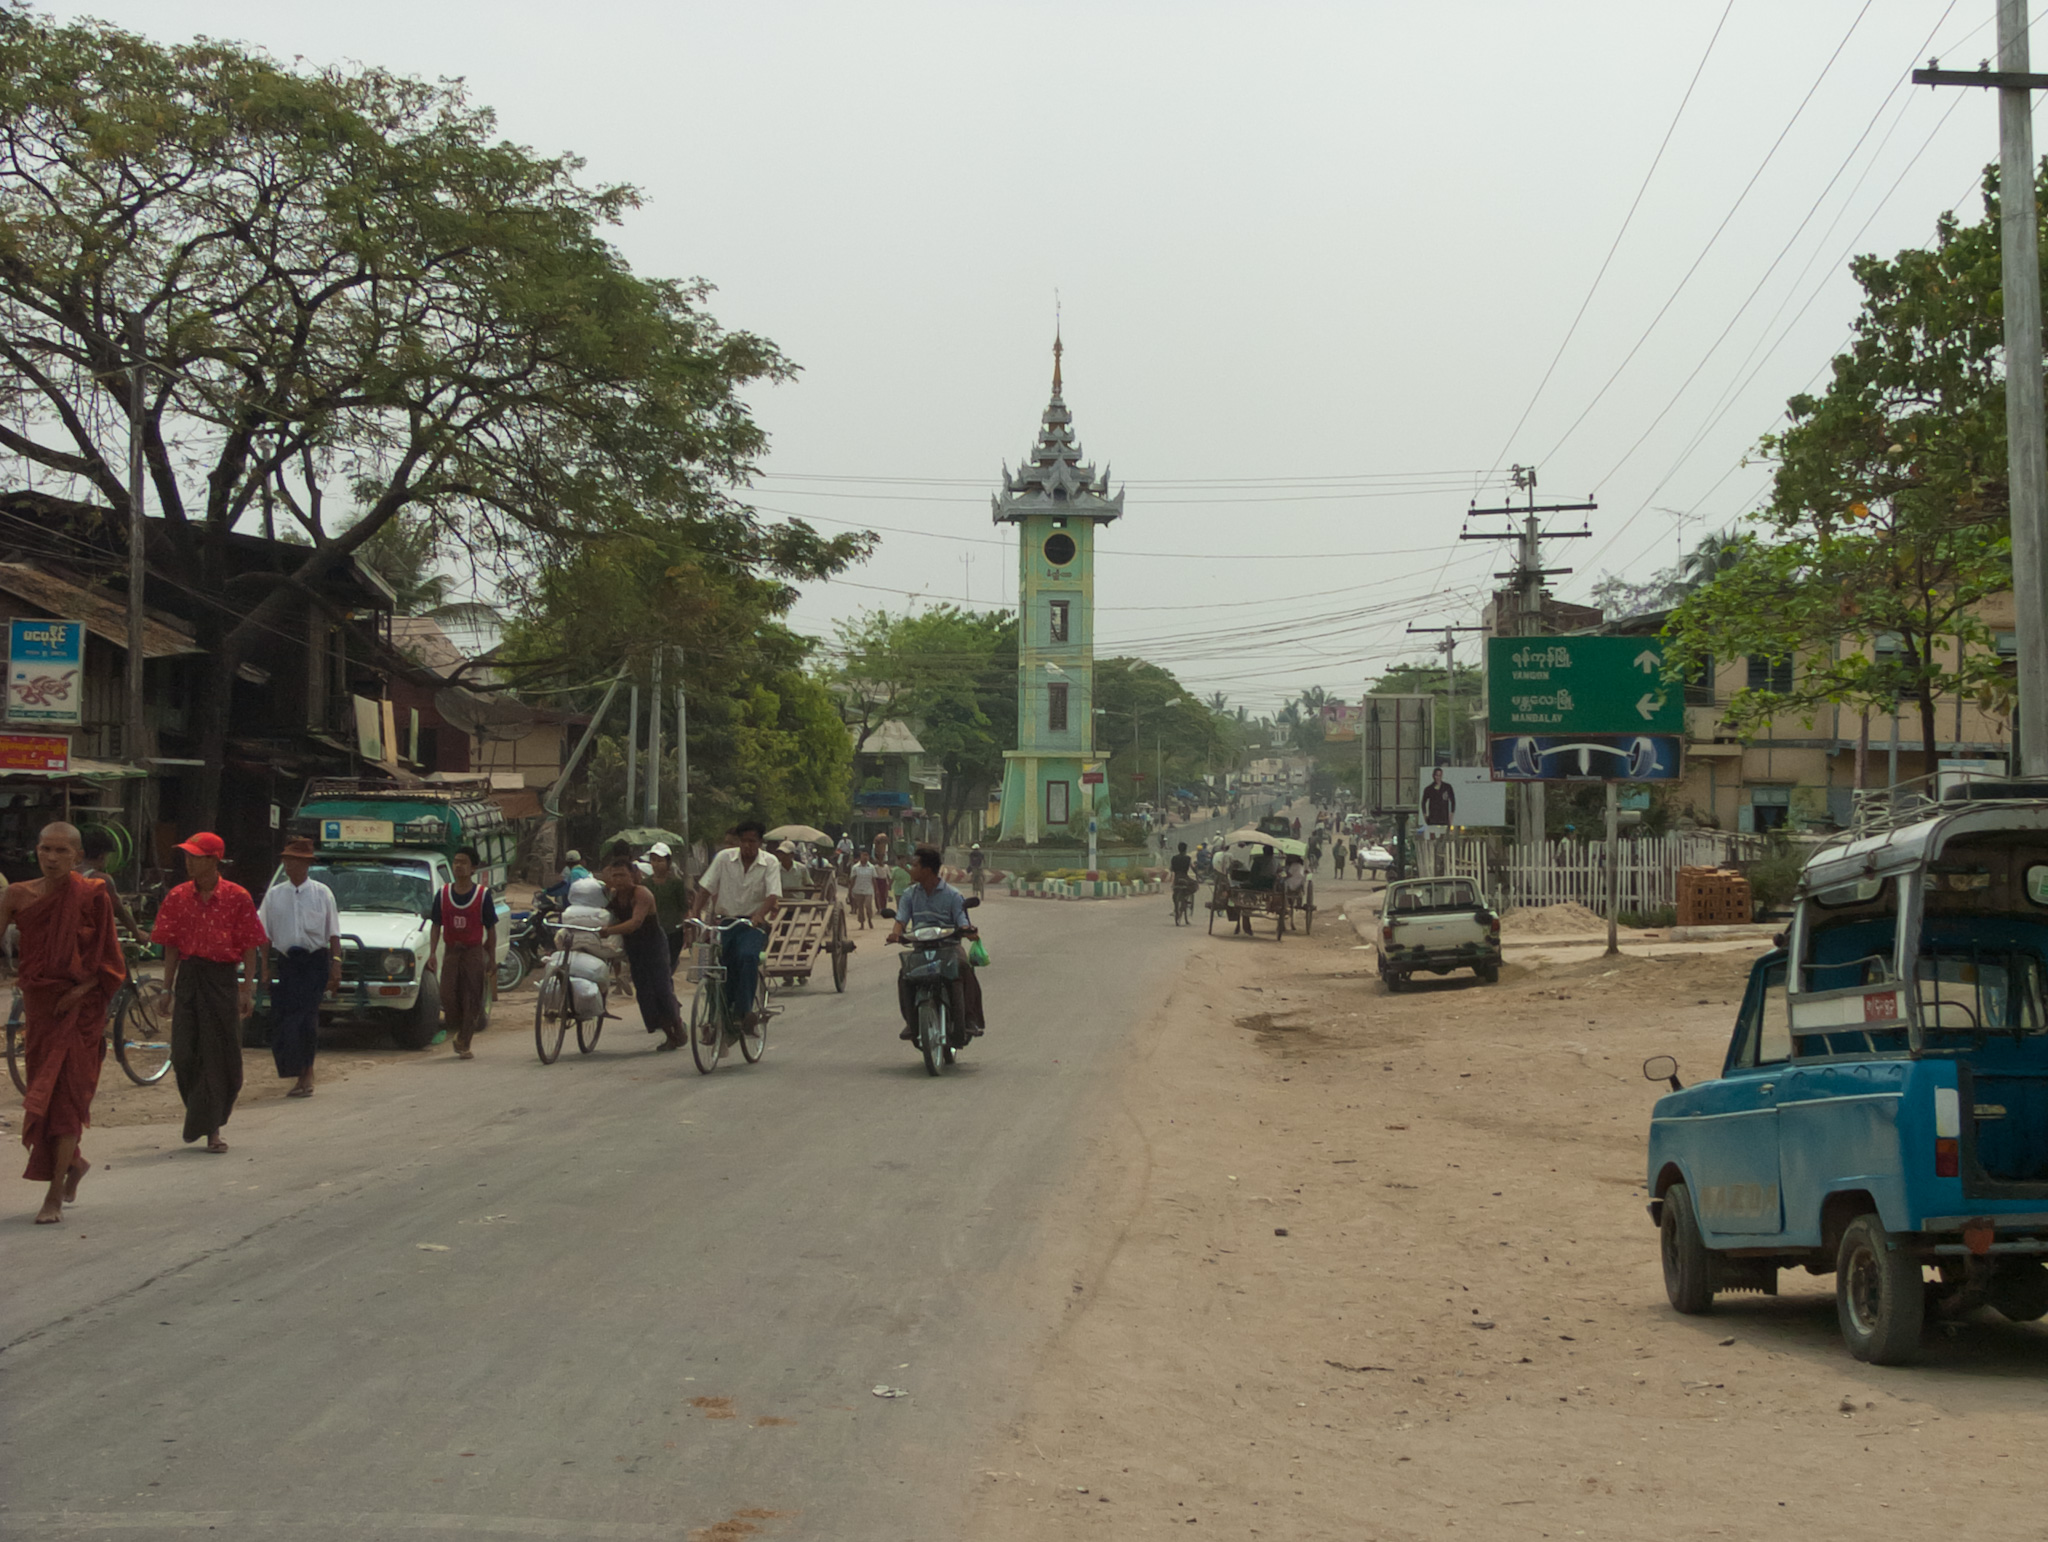
Myingyan
Myingyan est une ville de Birmanie centrale située dans la Région de Mandalay. En 2002, Myingyan avait une population de 123 700 habitants et son district 580 000. est située sur la rive orientale de l'Irrawaddy, au sud de Mandalay. La région est plate, surto..
Page Wikipédia de Myingyan

À propos de nos données
Les données de cette page sont estimées à l'aide de divers outils et ressources accessibles au public. Elles sont fournies sans garantie et peuvent contenir des inexactitudes. Utilisez-les à vos risques et périls.