Catégories à Kobe
les industries
Répartition des entreprises par secteur à Kobe
| Description de l'industrie | Nombre d'établissements | Âge moyen des entreprises |
|---|---|---|
| Restaurants | 9,512 | 14 years |
| Shopping | 5,768 | 16 years |
| Appartements | 5,054 | — |
| Gestion d'entreprise | 4,488 | 20 years |
| Construction de bâtiments | 4,070 | 24 years |
| Immobilier | 2,970 | 15 years |
| Cafés | 2,658 | 9 years |
| Restaurants japonais | 2,380 | — |
| Salons de coiffure | 2,341 | 12 years |
| Toute l'alimentation et les boissons | 2,265 | 33 years |
| Santé et médecine | 2,215 | 14 years |
| Instituts de beauté | 1,887 | 4 years |
| Bars, pubs et tavernes | 1,790 | 16 years |
| Parcs publics | 1,739 | 75 years |
| Éducation | 1,714 | 9 years |
| Boutiques de vêtements | 1,688 | 14 years |
Faits sur Kobe
| Région | 256.8 km² |
| Population | 1 166 167 |
| Population masculine | 552 897 (47.4%) |
| Population féminine | 613 270 (52.6%) |
| Variation de la population (1975 to 2020) | +14.6% |
| Variation de la population (2000 to 2020) | +9.0% |
| Age moyen | 45.1 ans (Hommes : 43.7, Femmes : 46.5) |
| PIB par habitant (PPA) | $35 815 (2022) |
| Codes Téléphone | 78, 797 |
| Voisinages | Chuo, Chuo Ward, Chuo Ward, Nakayamatedori, 1 Chome, Nada, Kita |
| Heure locale | |
| Fuseau horaire | heure normale du Japon |
| Lat. et long. | 34.69130, 135.18300 |
| Codes Postaux | 650, 651, 652, 654, 658, More |
Carte de Kobe
Carte interactive
Population de Kobe
Années 1975 à 2030
| Data | 1975 | 1990 | 2000 | 2015 | 2020 | 2025* | 2030* |
|---|---|---|---|---|---|---|---|
| Population | 1 017 967 | 1 089 126 | 1 069 400 | 1 055 282 | 1 166 167 | 1 105 575 | 1 049 489 |
| Densité de population | 3 963,9 / km² | 4 240,9 / km² | 4 164,1 / km² | 4 109,2 / km² | 4 540,9 / km² | 4 305 / km² | 4 086,6 / km² |
Variation de la population de Kobe de 2000 à 2020
Augmentation de 9% de l'année 2000 à 2020
| Lieu | Variation depuis 1975 | Variation depuis 1990 | Variation depuis 2000 |
|---|---|---|---|
| Kobe | +14.6% | +7.1% | +9% |
| Préfecture de Hyōgo | — | — | — |
| Japon | — | — | — |
Âge médian de Kobe
Âge médian : 45.1 ans
| Lieu | Age moyen | Âge médian (femme) | Âge médian (masculin) |
|---|---|---|---|
| Kobe | 45.1 yrs | 46.5 yrs | 43.7 yrs |
| Préfecture de Hyōgo | 45 yrs | 46.5 yrs | 43.6 yrs |
| Japon | 45.1 yrs | 46.9 yrs | 43.5 yrs |
Densité de population de Kobe
Densité de population : 4 541 / km²
| Lieu | Population | Région | Densité |
|---|---|---|---|
| Kobe | 1,2 million | 256,8 km² | 4 541 / km² |
| Préfecture de Hyōgo | 5,4 million | 8 396,6 km² | 645 / km² |
| Japon | 122,9 million | 373 410,9 km² | 329 / km² |
Population historique et projetée de Kobe
Population estimée de 1600 à 2100
- JRC (European Commission's Joint Research Centre) travailler sur GHS built-up grid
- CIESIN (Center for International Earth Science Information Network)
- [Lien] Klein Goldewijk, K., Beusen, A., Doelman, J., and Stehfest, E.: Anthropogenic land use estimates for the Holocene – HYDE 3.2, Earth Syst. Sci. Data, 9, 927–953, https://doi.org/10.5194/essd-9-927-2017, 2017.
Quartiers à Kobe
Pourcentage d'entreprises par quartier à Kobe
Codes Postaux
Pourcentage d'entreprises par code postal à Kobe
Distribution des prix
Répartition des activités par prix pour Kobe
Indice de développement humain (IDH)
Indice composite statistique de l'espérance de vie, de l'éducation et du revenu par habitant.
Produit intérieur brut (PIB) de Kobe
PIB par habitant, PPA (dollars internationaux constants de 2017)
| Data | 1990 | 1995 | 2000 | 2005 | 2010 | 2015 | 2020 | 2022 |
|---|---|---|---|---|---|---|---|---|
| PIB par habitant | $27 819 | $33 733 | $33 833 | $33 593 | $31 248 | $33 696 | $34 514 | $35 815 |
| PIB total | $7,7 Md | $9 Md | $8,3 Md | $7,9 Md | $7,3 Md | $7,5 Md | $7,4 Md | $7,5 Md |
Émissions de CO2 de Kobe
Émissions de dioxyde de carbone (CO2) par habitant en tonnes par an
| Lieu | Emissions de CO2 | Émissions de CO2 par habitant | Intensité des émissions de CO2 |
|---|---|---|---|
| Kobe | 2,882,302 tn | 2.47 tn | 11,223.4 tons/km² |
| Préfecture de Hyōgo | 5,432,186 tn | 1 tn | 647 tons/km² |
| Japon | 541,995,101 tn | 4.41 tn | 1,451.5 tons/km² |
| Émissions de CO2 en 2013 (tonnes/an) | 2,882,302 tn |
| Émissions de CO2 en 2013 (tonnes/an) par habitant | 2.47 tn |
| Intensité des émissions de CO2 en 2013 (tonnes/km²/an) | 11,223.4 tons/km² |
Risque de dangers naturels
Risque relatif sur 10
| Danger | Niveau de risque |
|---|---|
| Inonder | Moyen (7) |
| Tremblement de terre | Élevé (8) |
| Cyclone | Élevé (10) |
| Glissement de terrain | Élevé (9) |
* Les risques, en particulier concernant les inondations ou les glissements de terrain, peuvent ne pas concerner toute la zone.
- Dilley, M., R.S. Chen, U. Deichmann, A.L. Lerner-Lam, M. Arnold, J. Agwe, P. Buys, O. Kjekstad, B. Lyon, and G. Yetman. 2005. Natural Disaster Hotspots: A Global Risk Analysis. Washington, D.C.: World Bank. https://doi.org/10.1596/0-8213-5930-4.
- Center for Hazards and Risk Research - CHRR - Columbia University, Center for International Earth Science Information Network - CIESIN - Columbia University, and Norwegian Geotechnical Institute - NGI. 2005. Global Landslide Hazard Distribution. Palisades, NY: NASA Socioeconomic Data and Applications Center (SEDAC). https://doi.org/10.7927/H4P848VZ.
- Center for Hazards and Risk Research - CHRR - Columbia University, Center for International Earth Science Information Network - CIESIN - Columbia University, International Bank for Reconstruction and Development - The World Bank, and United Nations Environment Programme Global Resource Information Database Geneva - UNEP/GRID-Geneva. 2005. Global Cyclone Hazard Frequency and Distribution. Palisades, NY: NASA Socioeconomic Data and Applications Center (SEDAC). https://doi.org/10.7927/H4CZ353K.
- Center for Hazards and Risk Research - CHRR - Columbia University, Center for International Earth Science Information Network - CIESIN - Columbia University. 2005. Global Flood Hazard Frequency and Distribution. Palisades, NY: NASA Socioeconomic Data and Applications Center (SEDAC). https://doi.org/10.7927/H4668B3D.
- Center for Hazards and Risk Research - CHRR - Columbia University, Center for International Earth Science Information Network - CIESIN - Columbia University. 2005. Global Earthquake Hazard Distribution - Peak Ground Acceleration. Palisades, NY: NASA Socioeconomic Data and Applications Center (SEDAC). https://doi.org/10.7927/H4BZ63ZS.
Tremblements de terre récents à proximité
Magnitude 3.0 et plus
| Date▼ | Heure↕ | Magnitude↕ | Distance↕ | Profondeur↕ | Lieu↕ | Lien |
|---|---|---|---|---|---|---|
| 6/10/19 | 7:30 PM | 4.2 | 55.5 km | 366,200 m | 5km NW of Muko, Japan | usgs.gov |
| 7/8/18 | 6:45 AM | 3.8 | 46 km | 10,000 m | 4km SSW of Kameoka, Japan | usgs.gov |
| 6/23/18 | 2:08 PM | 3.9 | 47.1 km | 10,000 m | 2km NE of Hirakata, Japan | usgs.gov |
| 6/18/18 | 10:52 PM | 3.7 | 43.4 km | 10,000 m | 1km ENE of Neyagawa, Japan | usgs.gov |
| 6/18/18 | 3:31 PM | 4.6 | 40.5 km | 10,000 m | 2km NNW of Neyagawa, Japan | usgs.gov |
| 6/17/18 | 10:58 PM | 5.5 | 44.3 km | 10,340 m | 1km NW of Hirakata, Japan | usgs.gov |
| 11/17/14 | 9:07 PM | 4.3 | 15.7 km | 14,540 m | 8km ESE of Akashi, Japan | usgs.gov |
| 8/25/14 | 6:42 PM | 4.6 | 44.1 km | 27,590 m | 2km E of Sumoto, Japan | usgs.gov |
| 8/5/14 | 4:17 PM | 4.4 | 47 km | 26,690 m | 4km W of Kameoka, Japan | usgs.gov |
| 7/20/14 | 5:35 AM | 4 | 47.7 km | 373,250 m | 3km ESE of Hirakata, Japan | usgs.gov |
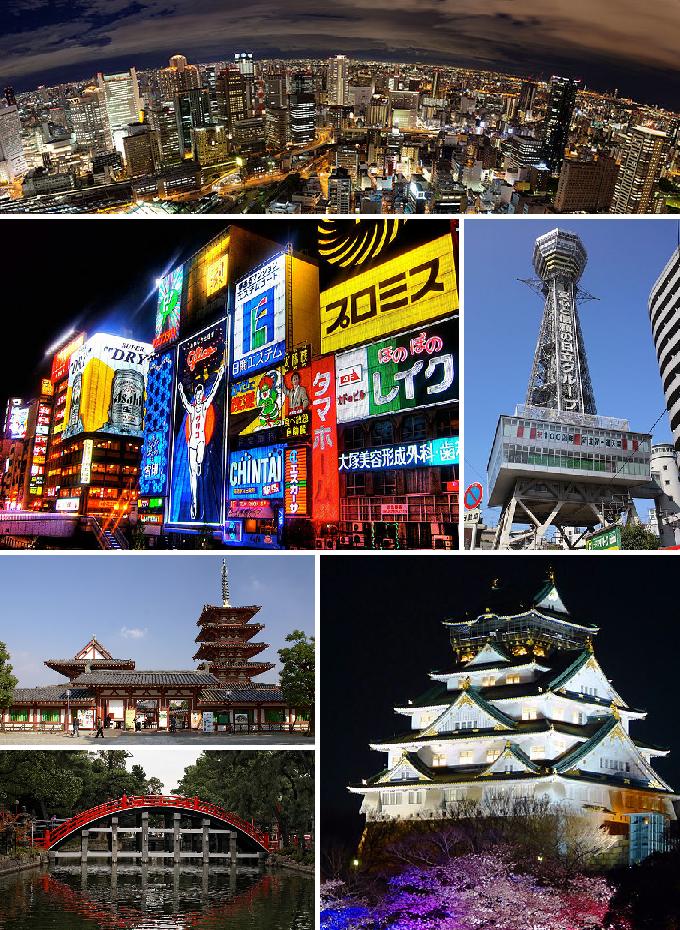
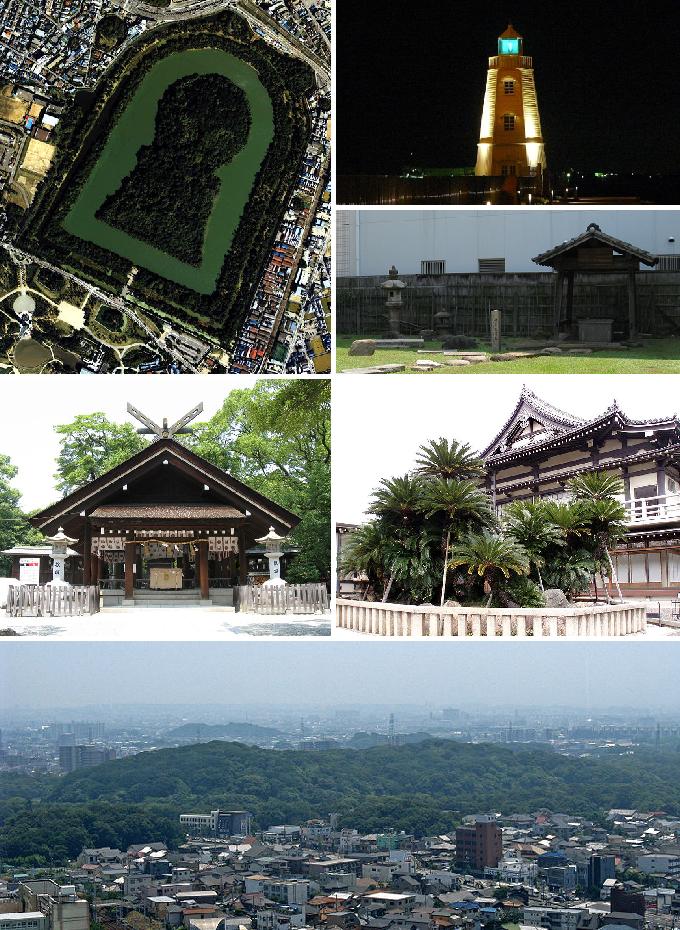
Kobe
Kobe (神戸市, Kōbe-shi, Kōbe signifiant porte des esprits (ou des dieux)), aussi Kobé, est la plus grande ville et la capitale de la préfecture de Hyōgo, située sur l'île de Honshū proche d'Osaka. La ville possède l'un des plus grands ports du Japon. Elle fait pa..
Page Wikipédia de Kobe

À propos de nos données
Les données de cette page sont estimées à l'aide de divers outils et ressources accessibles au public. Elles sont fournies sans garantie et peuvent contenir des inexactitudes. Utilisez-les à vos risques et périls.