Catégories à Iwakuni
les industries
Répartition des entreprises par secteur à Iwakuni
| Description de l'industrie | Nombre d'établissements |
|---|---|
| Restaurants | 594 |
| Religion | 466 |
| Shopping | 419 |
| Construction de bâtiments | 340 |
| Salons de coiffure | 325 |
| Administration publique | 302 |
| Gestion d'entreprise | 271 |
| Appartements | 236 |
| Éducation | 188 |
| Parcs publics | 183 |
| Autres organisations membres | 182 |
| Immobilier | 171 |
| Pharmacies | 168 |
Faits sur Iwakuni
| Région | 5.3 km² |
| Population | 17 546 |
| Population masculine | 8 351 (47.6%) |
| Population féminine | 9 195 (52.4%) |
| Variation de la population (1975 to 2020) | +8.6% |
| Variation de la population (2000 to 2020) | +21.9% |
| Age moyen | 49.6 ans (Hommes : 47.1, Femmes : 51.8) |
| Codes Téléphone | 827, 8275 |
| Voisinages | Marifumachi, 3 Chome, Imazumachi, 1 Chome, Shutomachi Shimokubara, Marifumachi, 6 Chome, Nishikimachihirose |
| Heure locale | |
| Fuseau horaire | heure normale du Japon |
| Lat. et long. | 34.16297, 132.22000 |
| Codes Postaux | 740, 741 |
Carte de Iwakuni
Carte interactive
Population de Iwakuni
Années 1975 à 2030
| Data | 1975 | 1990 | 2000 | 2015 | 2020 | 2025* | 2030* |
|---|---|---|---|---|---|---|---|
| Population | 16 157 | 15 931 | 14 396 | 12 750 | 17 546 | 17 284 | 16 940 |
| Densité de population | 3 077,5 / km² | 3 034,5 / km² | 2 742,1 / km² | 2 428,6 / km² | 3 342,1 / km² | 3 292,2 / km² | 3 226,7 / km² |
Variation de la population de Iwakuni de 2000 à 2020
Augmentation de 21.9% de l'année 2000 à 2020
| Lieu | Variation depuis 1975 | Variation depuis 1990 | Variation depuis 2000 |
|---|---|---|---|
| Iwakuni | +8.6% | +10.1% | +21.9% |
| Préfecture de Yamaguchi | — | — | — |
| Japon | — | — | — |
Âge médian de Iwakuni
Âge médian : 49.6 ans
| Lieu | Age moyen | Âge médian (femme) | Âge médian (masculin) |
|---|---|---|---|
| Iwakuni | 49.6 yrs | 51.8 yrs | 47.1 yrs |
| Préfecture de Yamaguchi | 50.1 yrs | 52.6 yrs | 47.3 yrs |
| Japon | 45.1 yrs | 46.9 yrs | 43.5 yrs |
Densité de population de Iwakuni
Densité de population : 3 342 / km²
| Lieu | Population | Région | Densité |
|---|---|---|---|
| Iwakuni | 17 546 | 5,3 km² | 3 342 / km² |
| Préfecture de Yamaguchi | 1,3 million | 6 109,4 km² | 219 / km² |
| Japon | 122,9 million | 373 410,9 km² | 329 / km² |
Population historique et projetée de Iwakuni
Population estimée de 800 à 2100
- JRC (European Commission's Joint Research Centre) travailler sur GHS built-up grid
- CIESIN (Center for International Earth Science Information Network)
- [Lien] Klein Goldewijk, K., Beusen, A., Doelman, J., and Stehfest, E.: Anthropogenic land use estimates for the Holocene – HYDE 3.2, Earth Syst. Sci. Data, 9, 927–953, https://doi.org/10.5194/essd-9-927-2017, 2017.
Quartiers à Iwakuni
Pourcentage d'entreprises par quartier à Iwakuni
Codes Postaux
Pourcentage d'entreprises par code postal à Iwakuni
Distribution des prix
Répartition des activités par prix pour Iwakuni
Indice de développement humain (IDH)
Indice composite statistique de l'espérance de vie, de l'éducation et du revenu par habitant.
Émissions de CO2 de Iwakuni
Émissions de dioxyde de carbone (CO2) par habitant en tonnes par an
| Lieu | Emissions de CO2 | Émissions de CO2 par habitant | Intensité des émissions de CO2 |
|---|---|---|---|
| Iwakuni | 5,346 tn | 0.3 tn | 1,018.2 tons/km² |
| Préfecture de Yamaguchi | 650,235 tn | 0.49 tn | 106.4 tons/km² |
| Japon | 541,995,101 tn | 4.41 tn | 1,451.5 tons/km² |
| Émissions de CO2 en 2013 (tonnes/an) | 5,346 tn |
| Émissions de CO2 en 2013 (tonnes/an) par habitant | 0.3 tn |
| Intensité des émissions de CO2 en 2013 (tonnes/km²/an) | 1,018.2 tons/km² |
Risque de dangers naturels
Risque relatif sur 10
| Danger | Niveau de risque |
|---|---|
| Inonder | Moyen (7) |
| Tremblement de terre | Moyen (6) |
| Cyclone | Élevé (10) |
* Les risques, en particulier concernant les inondations ou les glissements de terrain, peuvent ne pas concerner toute la zone.
- Dilley, M., R.S. Chen, U. Deichmann, A.L. Lerner-Lam, M. Arnold, J. Agwe, P. Buys, O. Kjekstad, B. Lyon, and G. Yetman. 2005. Natural Disaster Hotspots: A Global Risk Analysis. Washington, D.C.: World Bank. https://doi.org/10.1596/0-8213-5930-4.
- Center for Hazards and Risk Research - CHRR - Columbia University, Center for International Earth Science Information Network - CIESIN - Columbia University, International Bank for Reconstruction and Development - The World Bank, and United Nations Environment Programme Global Resource Information Database Geneva - UNEP/GRID-Geneva. 2005. Global Cyclone Hazard Frequency and Distribution. Palisades, NY: NASA Socioeconomic Data and Applications Center (SEDAC). https://doi.org/10.7927/H4CZ353K.
- Center for Hazards and Risk Research - CHRR - Columbia University, Center for International Earth Science Information Network - CIESIN - Columbia University. 2005. Global Flood Hazard Frequency and Distribution. Palisades, NY: NASA Socioeconomic Data and Applications Center (SEDAC). https://doi.org/10.7927/H4668B3D.
- Center for Hazards and Risk Research - CHRR - Columbia University, Center for International Earth Science Information Network - CIESIN - Columbia University. 2005. Global Earthquake Hazard Distribution - Peak Ground Acceleration. Palisades, NY: NASA Socioeconomic Data and Applications Center (SEDAC). https://doi.org/10.7927/H4BZ63ZS.
Tremblements de terre récents à proximité
Magnitude 3.0 et plus
| Date▼ | Heure↕ | Magnitude↕ | Distance↕ | Profondeur↕ | Lieu↕ | Lien |
|---|---|---|---|---|---|---|
| 1/8/18 | 8:52 PM | 4.6 | 49.1 km | 58,940 m | 27km S of Yanai, Japan | usgs.gov |
| 8/15/17 | 7:38 PM | 4.5 | 34.9 km | 58,110 m | 11km S of Yanai, Japan | usgs.gov |
| 8/15/16 | 4:36 AM | 4.9 | 81.7 km | 71,680 m | 17km ESE of Kunisaki-shi, Japan | usgs.gov |
| 7/18/16 | 9:22 PM | 4.3 | 82 km | 123,400 m | 17km NNE of Bungo-Takada-shi, Japan | usgs.gov |
| 7/1/16 | 5:39 AM | 4.9 | 82.4 km | 78,900 m | 5km SSE of Kunisaki-shi, Japan | usgs.gov |
| 7/24/15 | 8:53 AM | 4.6 | 85.2 km | 44,110 m | 18km WSW of Ozu, Japan | usgs.gov |
| 4/7/15 | 11:51 PM | 4.3 | 69.7 km | 49,710 m | 10km N of Ozu, Japan | usgs.gov |
| 2/3/15 | 5:07 AM | 4.5 | 87.2 km | 52,980 m | 17km E of Ozu, Japan | usgs.gov |
| 11/1/14 | 10:36 AM | 4.5 | 61.9 km | 73,970 m | 22km ENE of Kunisaki-shi, Japan | usgs.gov |
| 10/15/14 | 7:39 PM | 4.1 | 67.3 km | 49,960 m | 9km SSW of Iyo, Japan | usgs.gov |
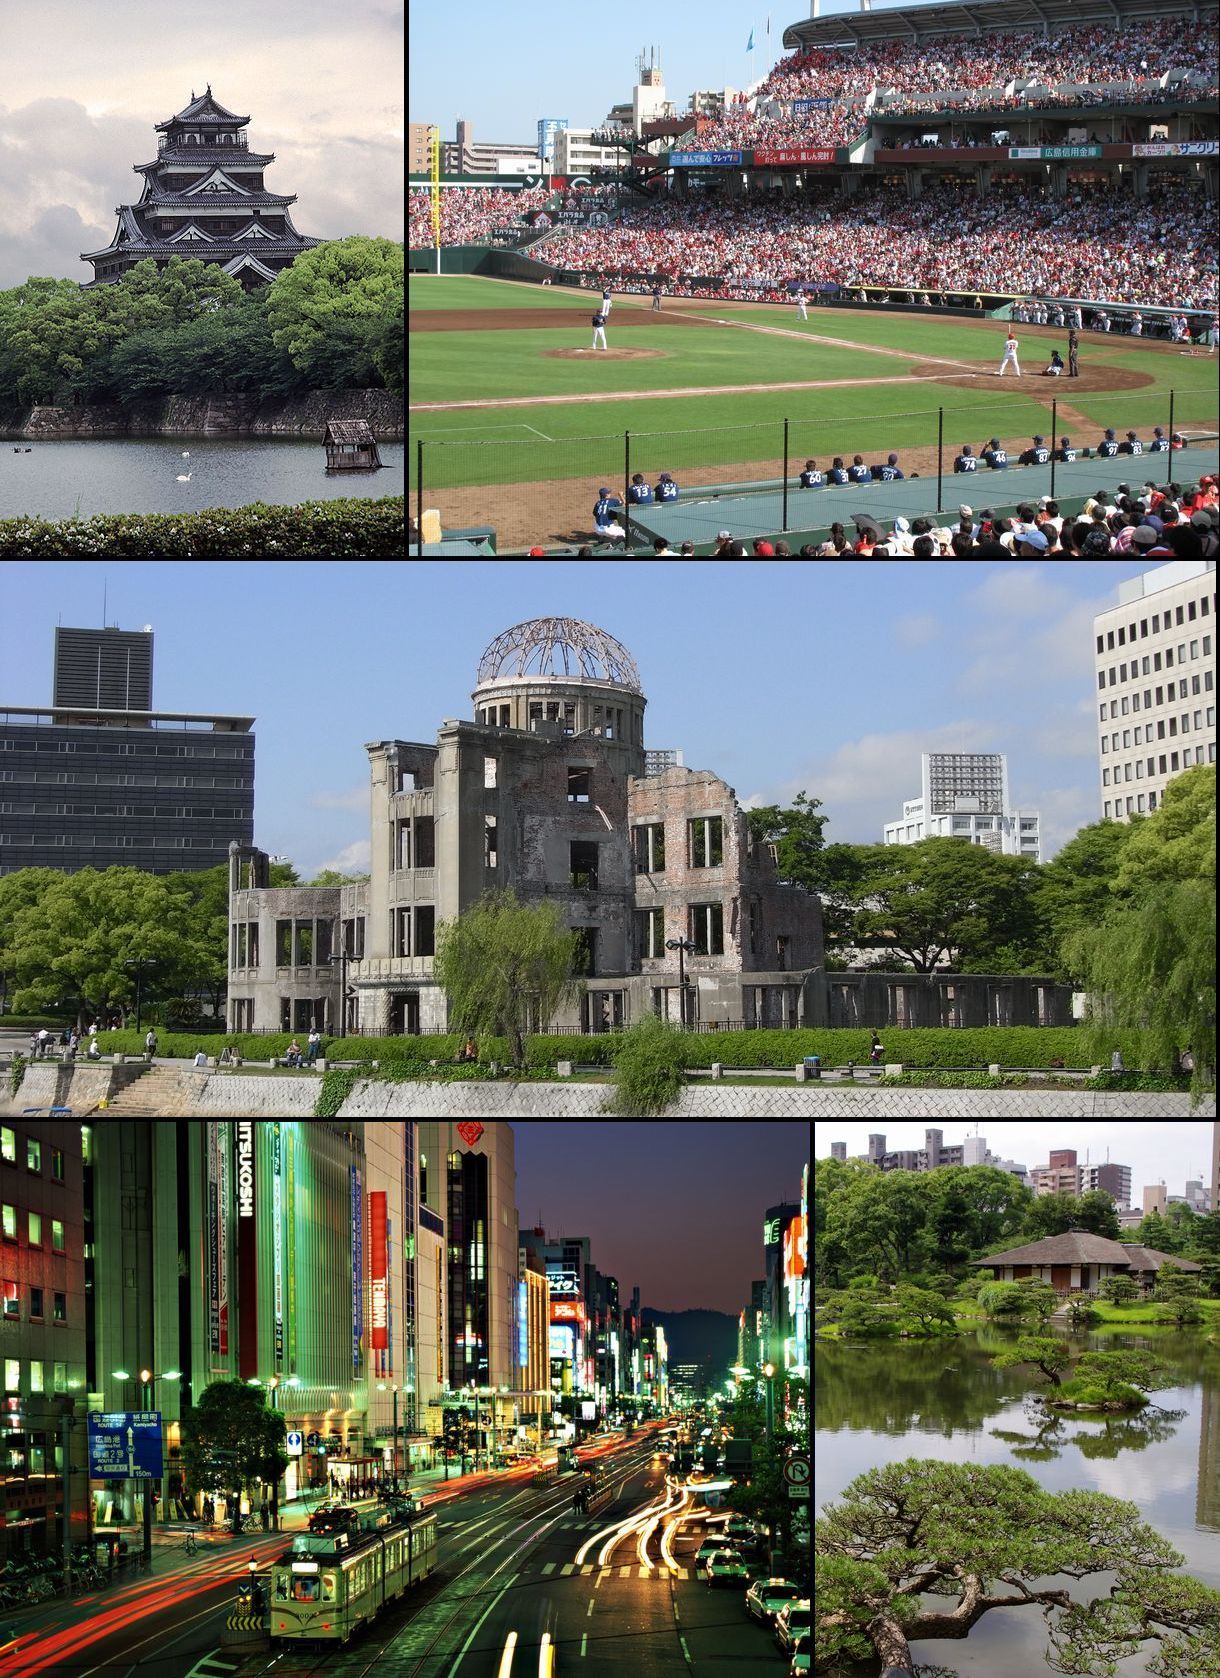
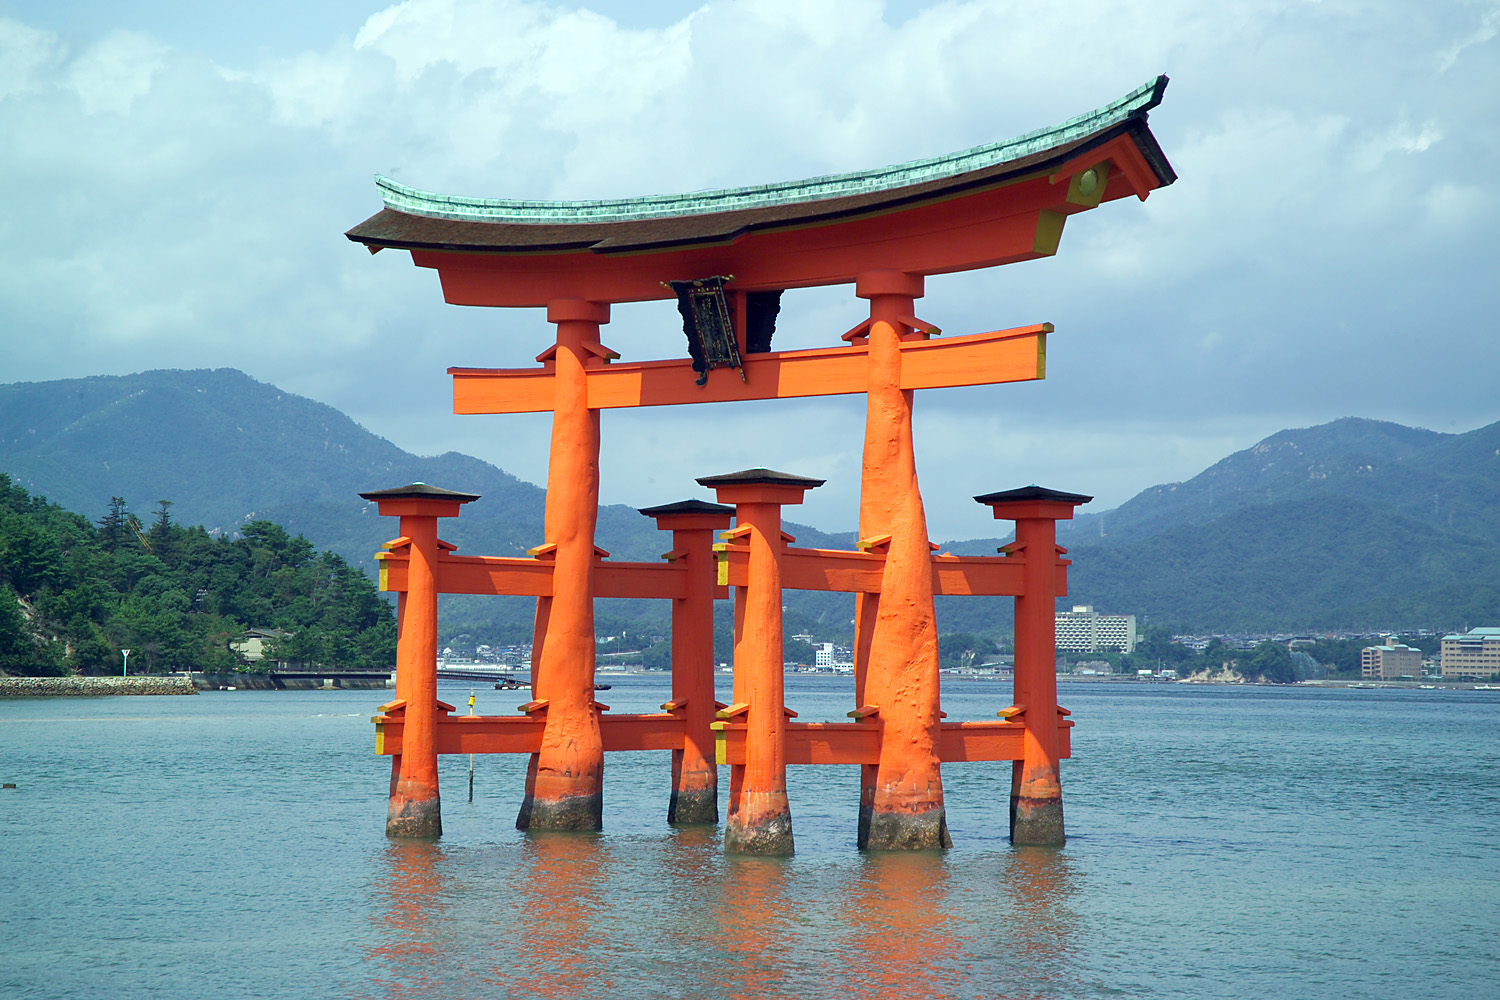
Iwakuni
Iwakuni (岩国市, Iwakuni-shi) est une ville de la préfecture de Yamaguchi au Japon. 2003, la population s'élevait à 104.647 habitants, et sa superficie était alors de 221,16 km², soit une densité de 473,17 personnes par km². Toutefois, le 20 mars 2006, la ville ..
Page Wikipédia de Iwakuni
À propos de nos données
Les données de cette page sont estimées à l'aide de divers outils et ressources accessibles au public. Elles sont fournies sans garantie et peuvent contenir des inexactitudes. Utilisez-les à vos risques et périls.