Catégories à Ichihara
les industries
Répartition des entreprises par secteur à Ichihara
| Description de l'industrie | Nombre d'établissements |
|---|---|
| Restaurants | 579 |
| Appartements | 502 |
| Construction de bâtiments | 447 |
| Shopping | 326 |
| Salons de coiffure | 266 |
| Gestion d'entreprise | 249 |
| Immobilier | 227 |
| Bus et trains | 170 |
| Parcs publics | 161 |
| Éducation | 147 |
| Santé et médecine | 138 |
| Religion | 129 |
| Toute l'alimentation et les boissons | 127 |
Faits sur Ichihara
| Région | 118.8 km² |
| Population | 211 052 |
| Population masculine | 107 660 (51.0%) |
| Population féminine | 103 392 (49.0%) |
| Variation de la population (1975 to 2020) | +42.8% |
| Variation de la population (2000 to 2020) | +14.2% |
| Age moyen | 44.9 ans (Hommes : 43.9, Femmes : 46.1) |
| PIB par habitant (PPA) | $17 827 (2022) |
| Codes Téléphone | 43, 436 |
| Voisinages | Ichihara, Goi, Anesaki, Yawata, Yawatakaigandori |
| Heure locale | |
| Fuseau horaire | heure normale du Japon |
| Lat. et long. | 35.51667, 140.08333 |
| Codes Postaux | 270, 284, 286, 289, 290, More |
Carte de Ichihara
Carte interactive
Population de Ichihara
Années 1975 à 2030
| Data | 1975 | 1990 | 2000 | 2015 | 2020 | 2025* | 2030* |
|---|---|---|---|---|---|---|---|
| Population | 147 806 | 173 153 | 184 795 | 196 541 | 211 052 | 205 187 | 199 348 |
| Densité de population | 1 244 / km² | 1 457,4 / km² | 1 555,3 / km² | 1 654,2 / km² | 1 776,3 / km² | 1 727 / km² | 1 677,8 / km² |
Variation de la population de Ichihara de 2000 à 2020
Augmentation de 14.2% de l'année 2000 à 2020
| Lieu | Variation depuis 1975 | Variation depuis 1990 | Variation depuis 2000 |
|---|---|---|---|
| Ichihara | +42.8% | +21.9% | +14.2% |
| Préfecture de Chiba | — | — | — |
| Japon | — | — | — |
Âge médian de Ichihara
Âge médian : 44.9 ans
| Lieu | Age moyen | Âge médian (femme) | Âge médian (masculin) |
|---|---|---|---|
| Ichihara | 44.9 yrs | 46.1 yrs | 43.9 yrs |
| Préfecture de Chiba | 44.2 yrs | 45.5 yrs | 43.1 yrs |
| Japon | 45.1 yrs | 46.9 yrs | 43.5 yrs |
Densité de population de Ichihara
Densité de population : 1 776 / km²
| Lieu | Population | Région | Densité |
|---|---|---|---|
| Ichihara | 211 052 | 118,8 km² | 1 776 / km² |
| Préfecture de Chiba | 6,2 million | 5 162,6 km² | 1 208 / km² |
| Japon | 122,9 million | 373 410,9 km² | 329 / km² |
Population historique et projetée de Ichihara
Population estimée de 700 à 2100
- JRC (European Commission's Joint Research Centre) travailler sur GHS built-up grid
- CIESIN (Center for International Earth Science Information Network)
- [Lien] Klein Goldewijk, K., Beusen, A., Doelman, J., and Stehfest, E.: Anthropogenic land use estimates for the Holocene – HYDE 3.2, Earth Syst. Sci. Data, 9, 927–953, https://doi.org/10.5194/essd-9-927-2017, 2017.
Quartiers à Ichihara
Pourcentage d'entreprises par quartier à Ichihara
Codes Postaux
Pourcentage d'entreprises par code postal à Ichihara
Distribution des prix
Répartition des activités par prix pour Ichihara
Indice de développement humain (IDH)
Indice composite statistique de l'espérance de vie, de l'éducation et du revenu par habitant.
Produit intérieur brut (PIB) de Ichihara
PIB par habitant, PPA (dollars internationaux constants de 2017)
| Data | 1990 | 1995 | 2000 | 2005 | 2010 | 2015 | 2020 | 2022 |
|---|---|---|---|---|---|---|---|---|
| PIB par habitant | $25 315 | $25 891 | $27 134 | $23 539 | $16 606 | $17 094 | $17 385 | $17 827 |
| PIB total | $3,4 Md | $3,6 Md | $3,9 Md | $3,5 Md | $2,5 Md | $2,6 Md | $2,6 Md | $2,7 Md |
Émissions de CO2 de Ichihara
Émissions de dioxyde de carbone (CO2) par habitant en tonnes par an
| Lieu | Emissions de CO2 | Émissions de CO2 par habitant | Intensité des émissions de CO2 |
|---|---|---|---|
| Ichihara | 1,033,112 tn | 4.9 tn | 8,695.3 tons/km² |
| Préfecture de Chiba | 33,268,145 tn | 5.33 tn | 6,444 tons/km² |
| Japon | 541,995,101 tn | 4.41 tn | 1,451.5 tons/km² |
| Émissions de CO2 en 2013 (tonnes/an) | 1,033,112 tn |
| Émissions de CO2 en 2013 (tonnes/an) par habitant | 4.9 tn |
| Intensité des émissions de CO2 en 2013 (tonnes/km²/an) | 8,695.3 tons/km² |
Risque de dangers naturels
Risque relatif sur 10
| Danger | Niveau de risque |
|---|---|
| Inonder | Moyen (4) |
| Tremblement de terre | Élevé (9) |
| Cyclone | Élevé (10) |
| Glissement de terrain | Moyen (6) |
* Les risques, en particulier concernant les inondations ou les glissements de terrain, peuvent ne pas concerner toute la zone.
- Dilley, M., R.S. Chen, U. Deichmann, A.L. Lerner-Lam, M. Arnold, J. Agwe, P. Buys, O. Kjekstad, B. Lyon, and G. Yetman. 2005. Natural Disaster Hotspots: A Global Risk Analysis. Washington, D.C.: World Bank. https://doi.org/10.1596/0-8213-5930-4.
- Center for Hazards and Risk Research - CHRR - Columbia University, Center for International Earth Science Information Network - CIESIN - Columbia University, and Norwegian Geotechnical Institute - NGI. 2005. Global Landslide Hazard Distribution. Palisades, NY: NASA Socioeconomic Data and Applications Center (SEDAC). https://doi.org/10.7927/H4P848VZ.
- Center for Hazards and Risk Research - CHRR - Columbia University, Center for International Earth Science Information Network - CIESIN - Columbia University, International Bank for Reconstruction and Development - The World Bank, and United Nations Environment Programme Global Resource Information Database Geneva - UNEP/GRID-Geneva. 2005. Global Cyclone Hazard Frequency and Distribution. Palisades, NY: NASA Socioeconomic Data and Applications Center (SEDAC). https://doi.org/10.7927/H4CZ353K.
- Center for Hazards and Risk Research - CHRR - Columbia University, Center for International Earth Science Information Network - CIESIN - Columbia University. 2005. Global Flood Hazard Frequency and Distribution. Palisades, NY: NASA Socioeconomic Data and Applications Center (SEDAC). https://doi.org/10.7927/H4668B3D.
- Center for Hazards and Risk Research - CHRR - Columbia University, Center for International Earth Science Information Network - CIESIN - Columbia University. 2005. Global Earthquake Hazard Distribution - Peak Ground Acceleration. Palisades, NY: NASA Socioeconomic Data and Applications Center (SEDAC). https://doi.org/10.7927/H4BZ63ZS.
Tremblements de terre récents à proximité
Magnitude 3.0 et plus
| Date▼ | Heure↕ | Magnitude↕ | Distance↕ | Profondeur↕ | Lieu↕ | Lien |
|---|---|---|---|---|---|---|
| 7/4/19 | 12:04 AM | 4.4 | 2.7 km | 76,000 m | 2km N of Ichihara, Japan | usgs.gov |
| 7/4/18 | 11:54 PM | 4.4 | 5.1 km | 81,290 m | 5km NNW of Ichihara, Japan | usgs.gov |
| 6/13/18 | 10:14 PM | 4.5 | 10.1 km | 70,170 m | 4km SE of Chiba-shi, Japan | usgs.gov |
| 5/3/18 | 5:17 PM | 4.4 | 12.3 km | 66,500 m | 1km NNE of Chiba-shi, Japan | usgs.gov |
| 3/18/18 | 3:59 AM | 4.4 | 6.7 km | 63,520 m | 6km ENE of Ichihara, Japan | usgs.gov |
| 3/5/18 | 6:31 AM | 4.4 | 9.9 km | 74,090 m | 5km SE of Chiba-shi, Japan | usgs.gov |
| 1/5/18 | 3:54 PM | 4.8 | 9.6 km | 73,410 m | 9km NW of Ichihara, Japan | usgs.gov |
| 1/4/18 | 6:20 AM | 4.4 | 11.8 km | 72,800 m | 4km ESE of Chiba-shi, Japan | usgs.gov |
| 1/2/18 | 10:48 AM | 4.5 | 7.9 km | 42,220 m | 7km NW of Ichihara, Japan | usgs.gov |
| 12/27/17 | 1:05 PM | 4.8 | 9.3 km | 69,340 m | 9km SW of Ichihara, Japan | usgs.gov |
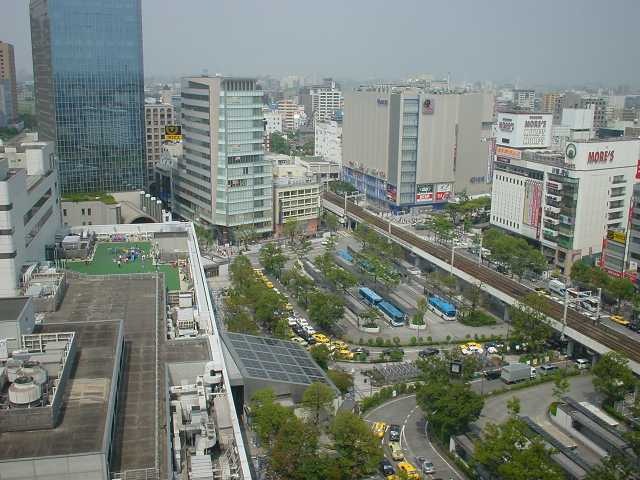
Ichihara
Ichihara (市原市, Ichihara-shi) est une ville (市, shi) de la préfecture de Chiba, au Japon. La ville a été fondée le 1er mai 1963. La population de la ville est de 279 282 habitants pour une superficie de 368,20 km² (2010).
Page Wikipédia de Ichihara


À propos de nos données
Les données de cette page sont estimées à l'aide de divers outils et ressources accessibles au public. Elles sont fournies sans garantie et peuvent contenir des inexactitudes. Utilisez-les à vos risques et périls.