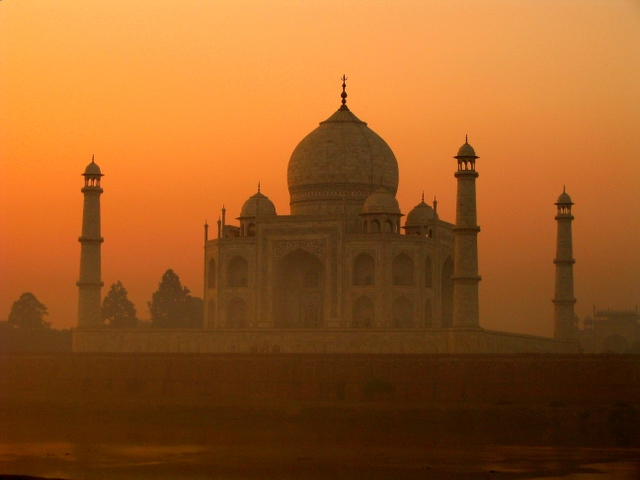
Catégories à Sadābād
les industries
Répartition des entreprises par secteur à Sadābād
| Description de l'industrie | Nombre d'établissements | Évaluation Google moyenne |
|---|---|---|
| Shopping | 77 | 3.9 |
| Magasin de bricolage | 14 | 4.4 |
| Religion | 12 | 4 |
Faits sur Sadābād
| Région | 371.2 km² |
| Population | 399 502 |
| Population masculine | 214 057 (53.6%) |
| Population féminine | 185 445 (46.4%) |
| Variation de la population (1975 to 2020) | +104.6% |
| Variation de la population (2000 to 2020) | +26.7% |
| Age moyen | 21 ans (Hommes : 20.5, Femmes : 21.5) |
| Codes Téléphone | 5661 |
| Voisinages | Karkauli, Radha Puram, Bhagat Singh Colony, Karkauli, Kamla Bazar, NayaGanj, Mahamaya Nagar |
| Heure locale | |
| Fuseau horaire | heure de l’Inde |
| Lat. et long. | 27.43818, 78.03758 |
| Codes Postaux | 281306 |
Carte de Sadābād
Carte interactive
Population de Sadābād
Années 1975 à 2020
| Data | 1975 | 1990 | 2000 | 2015 | 2020 |
|---|---|---|---|---|---|
| Population | 195 300 | 261 788 | 315 424 | 374 627 | 399 502 |
| Densité de population | 526,1 / km² | 705,3 / km² | 849,8 / km² | 1 009,3 / km² | 1 076,3 / km² |
Variation de la population de Sadābād de 2000 à 2015
Augmentation de 18.8% de l'année 2000 à 2015
| Lieu | Variation depuis 1975 | Variation depuis 1990 | Variation depuis 2000 |
|---|---|---|---|
| Sadābād | +91.8% | +43.1% | +18.8% |
| Uttar Pradesh | +134.1% | +59.5% | +28.4% |
| Inde | +111.1% | +50.6% | +24.5% |
Âge médian de Sadābād
Âge médian : 21 ans
| Lieu | Age moyen | Âge médian (femme) | Âge médian (masculin) |
|---|---|---|---|
| Sadābād | 21 yrs | 21.5 yrs | 20.5 yrs |
| Uttar Pradesh | 21.4 yrs | 21.7 yrs | 21 yrs |
| Inde | 24.9 yrs | 25.4 yrs | 24.5 yrs |
Densité de population de Sadābād
Densité de population : 1 076 / km²
| Lieu | Population | Région | Densité |
|---|---|---|---|
| Sadābād | 399 502 | 371,2 km² | 1 076 / km² |
| Uttar Pradesh | 217,8 million | 240 777,3 km² | 905 / km² |
| Inde | 1 307 million | 3 083 563,4 km² | 424 / km² |
Population historique et projetée de Sadābād
Population estimée de 0 à 2100
- JRC (European Commission's Joint Research Centre) travailler sur GHS built-up grid
- CIESIN (Center for International Earth Science Information Network)
- [Lien] Klein Goldewijk, K., Beusen, A., Doelman, J., and Stehfest, E.: Anthropogenic land use estimates for the Holocene – HYDE 3.2, Earth Syst. Sci. Data, 9, 927–953, https://doi.org/10.5194/essd-9-927-2017, 2017.
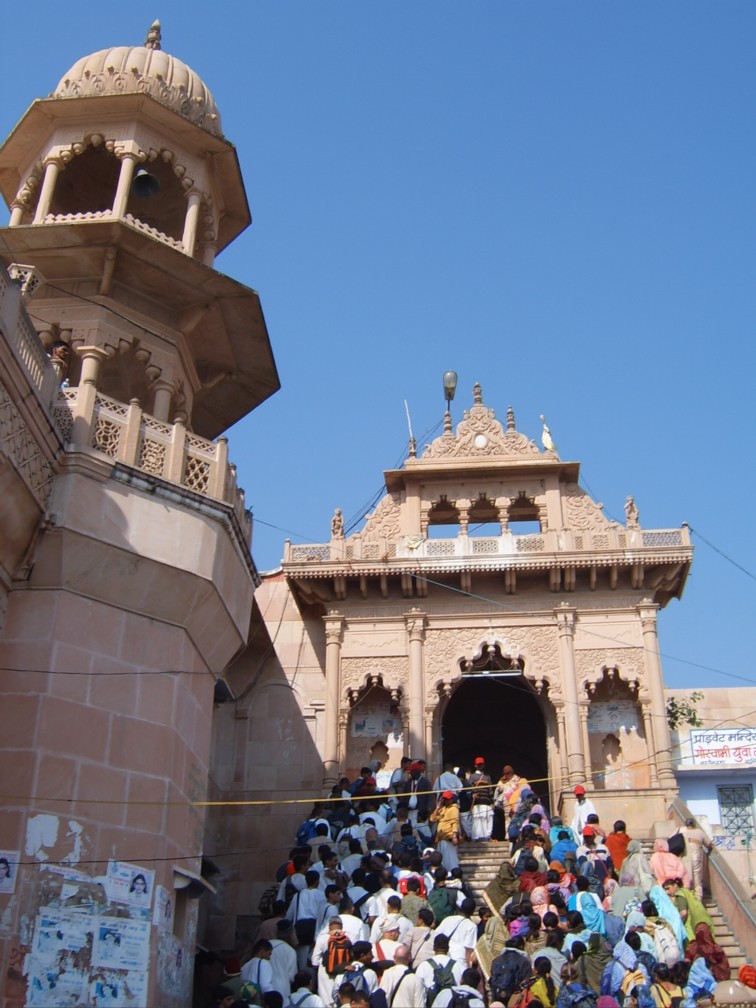
Quartiers à Sadābād
Pourcentage d'entreprises par quartier à Sadābād
Indice de développement humain (IDH)
Indice composite statistique de l'espérance de vie, de l'éducation et du revenu par habitant.
Émissions de CO2 de Sadābād
Émissions de dioxyde de carbone (CO2) par habitant en tonnes par an
| Lieu | Emissions de CO2 | Émissions de CO2 par habitant | Intensité des émissions de CO2 |
|---|---|---|---|
| Sadābād | 487,538 tn | 1.22 tn | 1,313.5 tons/km² |
| Uttar Pradesh | 259,048,938 tn | 1.19 tn | 1,075.9 tons/km² |
| Inde | 1,928,568,344 tn | 1.48 tn | 625.4 tons/km² |
| Émissions de CO2 en 2013 (tonnes/an) | 487,538 tn |
| Émissions de CO2 en 2013 (tonnes/an) par habitant | 1.22 tn |
| Intensité des émissions de CO2 en 2013 (tonnes/km²/an) | 1,313.5 tons/km² |
Risque de dangers naturels
Relative risk out of 10
| Danger | Risk Level |
|---|---|
| Drought | Medium (7) |
| Flood | High (10) |
| Earthquake | Medium (4) |
* Risk, particularly concerning flood or landslide, may not be for the entire area.
- Dilley, M., R.S. Chen, U. Deichmann, A.L. Lerner-Lam, M. Arnold, J. Agwe, P. Buys, O. Kjekstad, B. Lyon, and G. Yetman. 2005. Natural Disaster Hotspots: A Global Risk Analysis. Washington, D.C.: World Bank. https://doi.org/10.1596/0-8213-5930-4.
- Center for Hazards and Risk Research - CHRR - Columbia University, Center for International Earth Science Information Network - CIESIN - Columbia University, and International Research Institute for Climate and Society - IRI - Columbia University. 2005. Global Drought Hazard Frequency and Distribution. Palisades, NY: NASA Socioeconomic Data and Applications Center (SEDAC). https://doi.org/10.7927/H4VX0DFT.
- Center for Hazards and Risk Research - CHRR - Columbia University, Center for International Earth Science Information Network - CIESIN - Columbia University. 2005. Global Flood Hazard Frequency and Distribution. Palisades, NY: NASA Socioeconomic Data and Applications Center (SEDAC). https://doi.org/10.7927/H4668B3D.
- Center for Hazards and Risk Research - CHRR - Columbia University, Center for International Earth Science Information Network - CIESIN - Columbia University. 2005. Global Earthquake Hazard Distribution - Peak Ground Acceleration. Palisades, NY: NASA Socioeconomic Data and Applications Center (SEDAC). https://doi.org/10.7927/H4BZ63ZS.
Tremblements de terre récents à proximité
Magnitude 3.0 et plus
| Date▼ | Heure↕ | Magnitude↕ | Distance↕ | Profondeur↕ | Lieu↕ | Lien |
|---|---|---|---|---|---|---|
| 10/18/07 | 5:54 AM | 4.7 | 57.5 km | 10,000 m | Rajasthan-Uttar Pradesh border region, India | usgs.gov |

À propos de nos données
Les données de cette page sont estimées à l'aide de divers outils et ressources accessibles au public. Elles sont fournies sans garantie et peuvent contenir des inexactitudes. Utilisez-les à vos risques et périls.