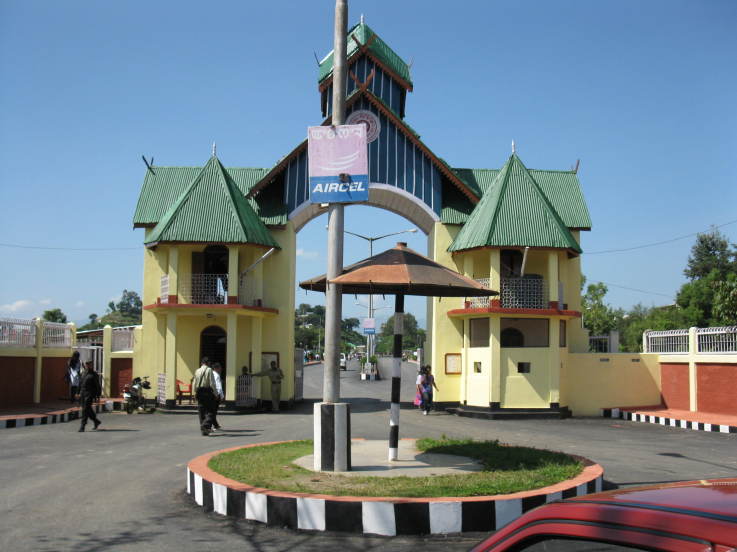
Catégories à Moirāng
les industries
Répartition des entreprises par secteur à Moirāng
| Description de l'industrie | Nombre d'établissements |
|---|---|
| Shopping | 48 |
| Éducation | 44 |
| Appartements | 22 |
| Pharmacies | 20 |
| Religion | 20 |
| Boutiques d'appareils électroniques | 19 |
| Hôtels et motels | 17 |
| Épiceries et supermarchés | 16 |
| Autres organisations membres | 16 |
| Restaurants | 16 |
| Gestion d'entreprise | 12 |
| Administration publique | 11 |
| Voyages et transports | 11 |
| Shopping Autres | 11 |
Faits sur Moirāng
| Région | 192.0 km² |
| Population | 126 056 |
| Population masculine | 63 193 (50.1%) |
| Population féminine | 62 863 (49.9%) |
| Variation de la population (1975 to 2020) | +96.2% |
| Variation de la population (2000 to 2020) | +22.1% |
| Age moyen | 26.2 ans (Hommes : 26, Femmes : 26.4) |
| PIB par habitant (PPA) | $2 875 (2022) |
| Voisinages | Pasang Leikai, Hemam Leikai, Moirangthem Leikai, Hemam Colony, Pukhram Leikai |
| Heure locale | |
| Fuseau horaire | heure de l’Inde |
| Lat. et long. | 24.49750, 93.77791 |
Carte de Moirāng
Carte interactive
Population de Moirāng
Années 1975 à 2030
| Data | 1975 | 1990 | 2000 | 2015 | 2020 | 2025* | 2030* |
|---|---|---|---|---|---|---|---|
| Population | 64 262 | 87 554 | 103 258 | 121 999 | 126 056 | 133 333 | 141 019 |
| Densité de population | 334,7 / km² | 456 / km² | 537,8 / km² | 635,4 / km² | 656,5 / km² | 694,4 / km² | 734,5 / km² |
Variation de la population de Moirāng de 2000 à 2020
Augmentation de 22.1% de l'année 2000 à 2020
| Lieu | Variation depuis 1975 | Variation depuis 1990 | Variation depuis 2000 |
|---|---|---|---|
| Moirāng | +96.2% | +44% | +22.1% |
| Manipur | — | — | — |
| Inde | — | — | — |
Âge médian de Moirāng
Âge médian : 26.2 ans
| Lieu | Age moyen | Âge médian (femme) | Âge médian (masculin) |
|---|---|---|---|
| Moirāng | 26.2 yrs | 26.4 yrs | 26 yrs |
| Manipur | 24.9 yrs | 25.2 yrs | 24.6 yrs |
| Inde | 24.9 yrs | 25.4 yrs | 24.5 yrs |
Densité de population de Moirāng
Densité de population : 657 / km²
| Lieu | Population | Région | Densité |
|---|---|---|---|
| Moirāng | 126 056 | 192 km² | 657 / km² |
| Manipur | 3,2 million | 22 308,8 km² | 144 / km² |
| Inde | 1 307 million | 3 083 563,4 km² | 424 / km² |
Population historique et projetée de Moirāng
Population estimée de 1740 à 2100
- JRC (European Commission's Joint Research Centre) travailler sur GHS built-up grid
- CIESIN (Center for International Earth Science Information Network)
- [Lien] Klein Goldewijk, K., Beusen, A., Doelman, J., and Stehfest, E.: Anthropogenic land use estimates for the Holocene – HYDE 3.2, Earth Syst. Sci. Data, 9, 927–953, https://doi.org/10.5194/essd-9-927-2017, 2017.
Quartiers à Moirāng
Pourcentage d'entreprises par quartier à Moirāng
Indice de développement humain (IDH)
Indice composite statistique de l'espérance de vie, de l'éducation et du revenu par habitant.
Produit intérieur brut (PIB) de Moirāng
PIB par habitant, PPA (dollars internationaux constants de 2017)
| Data | 1990 | 1995 | 2000 | 2005 | 2010 | 2015 | 2020 | 2022 |
|---|---|---|---|---|---|---|---|---|
| PIB par habitant | $777 | $718 | $1 140 | $1 450 | $1 312 | $1 832 | $2 310 | $2 875 |
| PIB total | $32 M | $33,4 M | $58,7 M | $80,3 M | $76,9 M | $113,3 M | $150,8 M | $190,7 M |
Émissions de CO2 de Moirāng
Émissions de dioxyde de carbone (CO2) par habitant en tonnes par an
| Lieu | Emissions de CO2 | Émissions de CO2 par habitant | Intensité des émissions de CO2 |
|---|---|---|---|
| Moirāng | 153,562 tn | 1.22 tn | 799.8 tons/km² |
| Manipur | 3,768,697 tn | 1.18 tn | 168.9 tons/km² |
| Inde | 1,928,568,344 tn | 1.48 tn | 625.4 tons/km² |
| Émissions de CO2 en 2013 (tonnes/an) | 153,562 tn |
| Émissions de CO2 en 2013 (tonnes/an) par habitant | 1.22 tn |
| Intensité des émissions de CO2 en 2013 (tonnes/km²/an) | 799.8 tons/km² |
Risque de dangers naturels
Risque relatif sur 10
| Danger | Niveau de risque |
|---|---|
| Sécheresse | Moyen (4) |
| Inonder | Moyen (7) |
| Tremblement de terre | Élevé (9.3) |
| Glissement de terrain | Élevé (10) |
* Les risques, en particulier concernant les inondations ou les glissements de terrain, peuvent ne pas concerner toute la zone.
- Dilley, M., R.S. Chen, U. Deichmann, A.L. Lerner-Lam, M. Arnold, J. Agwe, P. Buys, O. Kjekstad, B. Lyon, and G. Yetman. 2005. Natural Disaster Hotspots: A Global Risk Analysis. Washington, D.C.: World Bank. https://doi.org/10.1596/0-8213-5930-4.
- Center for Hazards and Risk Research - CHRR - Columbia University, Center for International Earth Science Information Network - CIESIN - Columbia University, and Norwegian Geotechnical Institute - NGI. 2005. Global Landslide Hazard Distribution. Palisades, NY: NASA Socioeconomic Data and Applications Center (SEDAC). https://doi.org/10.7927/H4P848VZ.
- Center for Hazards and Risk Research - CHRR - Columbia University, Center for International Earth Science Information Network - CIESIN - Columbia University, and International Research Institute for Climate and Society - IRI - Columbia University. 2005. Global Drought Hazard Frequency and Distribution. Palisades, NY: NASA Socioeconomic Data and Applications Center (SEDAC). https://doi.org/10.7927/H4VX0DFT.
- Center for Hazards and Risk Research - CHRR - Columbia University, Center for International Earth Science Information Network - CIESIN - Columbia University. 2005. Global Flood Hazard Frequency and Distribution. Palisades, NY: NASA Socioeconomic Data and Applications Center (SEDAC). https://doi.org/10.7927/H4668B3D.
- Center for Hazards and Risk Research - CHRR - Columbia University, Center for International Earth Science Information Network - CIESIN - Columbia University. 2005. Global Earthquake Hazard Distribution - Peak Ground Acceleration. Palisades, NY: NASA Socioeconomic Data and Applications Center (SEDAC). https://doi.org/10.7927/H4BZ63ZS.
Tremblements de terre récents à proximité
Magnitude 3.0 et plus
| Date▼ | Heure↕ | Magnitude↕ | Distance↕ | Profondeur↕ | Lieu↕ | Lien |
|---|---|---|---|---|---|---|
| 8/18/19 | 6:28 AM | 4.9 | 51.5 km | 66,440 m | 39km SE of Churachandpur, India | usgs.gov |
| 3/25/19 | 12:41 PM | 4.6 | 33.8 km | 56,650 m | 16km W of Churachandpur, India | usgs.gov |
| 2/3/19 | 5:20 PM | 4.5 | 11 km | 66,280 m | 10km S of Mayang Imphal, India | usgs.gov |
| 1/27/19 | 11:45 PM | 4.7 | 27 km | 65,340 m | 9km SSE of Kakching, India | usgs.gov |
| 1/27/19 | 4:49 AM | 4.7 | 63.1 km | 67,970 m | 28km ENE of Yairipok, India | usgs.gov |
| 1/25/19 | 5:07 PM | 4.6 | 23.8 km | 55,870 m | 21km SSW of Kakching, India | usgs.gov |
| 11/10/18 | 5:15 PM | 5.2 | 70.1 km | 52,390 m | 48km SW of Churachandpur, India | usgs.gov |
| 11/6/18 | 10:50 PM | 4.2 | 58.4 km | 64,340 m | 37km ESE of Kakching, India | usgs.gov |
| 9/25/18 | 8:51 PM | 4.2 | 31.1 km | 57,720 m | 26km ESE of Churachandpur, India | usgs.gov |
| 6/21/18 | 3:31 AM | 4.6 | 63.9 km | 59,130 m | 49km SSE of Churachandpur, India | usgs.gov |

À propos de nos données
Les données de cette page sont estimées à l'aide de divers outils et ressources accessibles au public. Elles sont fournies sans garantie et peuvent contenir des inexactitudes. Utilisez-les à vos risques et périls.