- Monde
- »
- IN
- »
- Jharkhand
- »
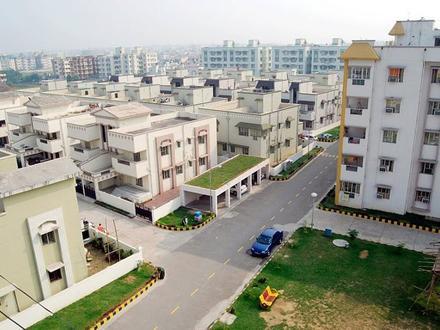
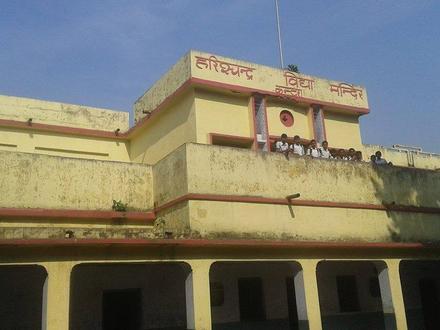
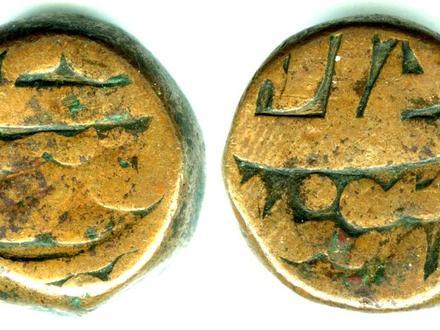
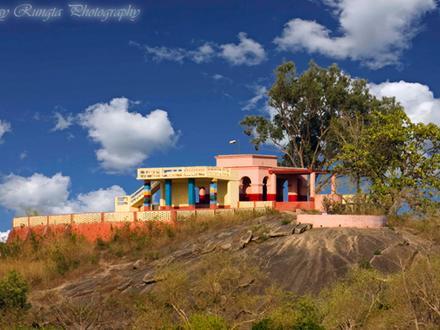
- Chāndil, Jharkhand
Commerces à Chāndil
Hôtels & Voyage
Restaurants
Automobile
Services financiers
Médical
Beauté & Spas
Organisme communautaire et gouvernemental
les industries
Répartition des entreprises par industrie Shopping: 31,8 %
Nourriture: 11 %
Religion: 10,1 %
Éducation: 9,9 %
Autre: 37,1 %
| Agglomération de Chāndil, Jharkhand | 379,2 km² |
| Population | 143 240 |
| Population masculine | 73 463 (51,3 %) |
| Population féminine | 69 776 (48,7 %) |
| Changement de la population entre 1975 et 2015 | +165,2 % |
| Changement de la population entre 2000 et 2015 | +40,3 % |
| Age moyen | 24,3 |
| Age masculin moyen | 24,1 |
| Age féminin moyen | 24,6 |
| Codes Téléphone | 6591 |
| Heure locale | mercredi 02:29 |
| Fuseau horaire | heure de l’Inde |
| Lat. et long. | 22.95745° / 86.05331° |
| Codes Postaux | 832403 |
Chāndil, Jharkhand - Carte
Population de Chāndil, Jharkhand
Période allant de 1975 à 2015| Les données | 1975 | 1990 | 2000 | 2015 |
|---|---|---|---|---|
| Population | 54 018 | 82 203 | 102 090 | 143 240 |
| Densité de population | 142,5 / km² | 216,8 / km² | 269,3 / km² | 377,8 / km² |
Changement de la population de 2000 à 2015 à Chāndil
Augmentation de 40,3 % à partir de 2000 jusqu'en 2015| Lieu | Changement depuis 1975 | Changement depuis 1990 | Changement depuis 2000 |
|---|---|---|---|
| Chāndil, Jharkhand | +165,2 % | +74,3 % | +40,3 % |
| Jharkhand | +152,1 % | +66,7 % | +32 % |
| Inde | +111,1 % | +50,6 % | +24,5 % |
Âge médian de Chāndil, Jharkhand
Âge médian : 24,3 ans| Lieu | Age moyen | Âge médian (femme) | Âge médian (masculin) |
|---|---|---|---|
| Chāndil, Jharkhand | 24,3 ans | 24,6 ans | 24,1 ans |
| Jharkhand | 22,4 ans | 22,6 ans | 22,2 ans |
| Inde | 24,9 ans | 25,4 ans | 24,5 ans |
Arbre démographique de Chāndil, Jharkhand
Population par âge et sexe| Âge | Homme | Femme | Total |
|---|---|---|---|
| Moins de 5 ans | 7 557 | 7 115 | 14 673 |
| 5-9 | 8 333 | 7 803 | 16 136 |
| 10-14 | 8 231 | 7 735 | 15 967 |
| 15-19 | 7 316 | 6 441 | 13 757 |
| 20-24 | 6 439 | 6 307 | 12 747 |
| 25-29 | 6 146 | 5 985 | 12 132 |
| 30-34 | 5 287 | 5 103 | 10 391 |
| 35-39 | 5 124 | 4 824 | 9 949 |
| 40-44 | 4 386 | 4 065 | 8 452 |
| 45-49 | 3 860 | 3 382 | 7 243 |
| 50-54 | 2 889 | 2 646 | 5 536 |
| 55-59 | 2 260 | 2 245 | 4 506 |
| 60-64 | 2 253 | 2 515 | 4 769 |
| 65-69 | 1 572 | 1 660 | 3 233 |
| 70-74 | 960 | 1 005 | 1 966 |
| 75-79 | 399 | 439 | 839 |
| 80-84 | 242 | 273 | 516 |
| 85 Plus | 207 | 229 | 437 |
Densité de la population de Chāndil, Jharkhand
Densité de la population : 377,8 / km²| Lieu | Population | Région | Densité de population |
|---|---|---|---|
| Chāndil, Jharkhand | 143 240 | 379,2 km² | 377,8 / km² |
| Jharkhand | 36,4 millions | 79 884,8 km² | 455,2 / km² |
| Inde | 1,3 milliards | 3 083 563,4 km² | 423,8 / km² |
Chāndil, Jharkhand : Population historique et projetée
Estimation de la population ancienne jusqu'en 2100Sources:
1. JRC (European Commission's Joint Research Centre) work on the GHS built-up grid
2. CIESIN (Center for International Earth Science Information Network)
3. [Lien] Klein Goldewijk, K., Beusen, A., Doelman, J., and Stehfest, E.: Anthropogenic land use estimates for the Holocene – HYDE 3.2, Earth Syst. Sci. Data, 9, 927–953, https://doi.org/10.5194/essd-9-927-2017, 2017.
Codes de zone
Pourcentage des indicatifs régionaux utilisés par les entreprises de Chāndil Code du Téléphone 657: 33,3 %
Code du Téléphone 6591: 33,3 %
Code du Téléphone 8407: 33,3 %
Indice de développement humain (IDH)
Indice composite statistique de l'espérance de vie, de l'éducation et du revenu par habitant.Sources: [Link] Kummu, M., Taka, M. & Guillaume, J. Gridded global datasets for Gross Domestic Product and Human Development Index over 1990–2015. Sci Data 5, 180004 (2018) doi:10.1038/sdata.2018.4
Émissions de CO2 à Chāndil, Jharkhand
Émissions de dioxyde de carbone (CO2) par habitant en tonnes par an| Lieu | Emissions de CO2 | Émissions de CO2 par habitant | Intensité des émissions de CO2 |
|---|---|---|---|
| Chāndil, Jharkhand | 183 537 sh tn | 1,28 sh tn | 484,1 sh tn/km² |
| Jharkhand | 43 755 342 sh tn | 1,2 sh tn | 547,7 sh tn/km² |
| Inde | 1 928 568 344 sh tn | 1,48 sh tn | 625,4 sh tn/km² |
Émissions de CO2 à Chāndil, Jharkhand
| Émissions de CO2 (tonnes/an) en 2013 | 183 537 sh tn |
| Émissions de CO2 (tonnes/an) par habitant en 2013 | 1,28 sh tn |
| Intensité des émissions de CO2 (tonnes/km²/an) pour l'année 2013 | 484,1 sh tn/km² |
Risque de dangers naturels
Risque relatif sur 10| Sécheresse | Élevé (7) |
| Inonder | Élevé (10) |
* Les risques, en particulier concernant les inondations ou les glissements de terrain, peuvent ne pas concerner toute la zone.
Sources: 1. Dilley, M., R.S. Chen, U. Deichmann, A.L. Lerner-Lam, M. Arnold, J. Agwe, P. Buys, O. Kjekstad, B. Lyon, and G. Yetman. 2005. Natural Disaster Hotspots: A Global Risk Analysis. Washington, D.C.: World Bank. https://doi.org/10.1596/0-8213-5930-4.
2. Center for Hazards and Risk Research - CHRR - Columbia University, Center for International Earth Science Information Network - CIESIN - Columbia University, and International Research Institute for Climate and Society - IRI - Columbia University. 2005. Global Drought Hazard Frequency and Distribution. Palisades, NY: NASA Socioeconomic Data and Applications Center (SEDAC). https://doi.org/10.7927/H4VX0DFT.
3. Center for Hazards and Risk Research - CHRR - Columbia University, Center for International Earth Science Information Network - CIESIN - Columbia University. 2005. Global Flood Hazard Frequency and Distribution. Palisades, NY: NASA Socioeconomic Data and Applications Center (SEDAC). https://doi.org/10.7927/H4668B3D.
Tremblements de terre récents à proximité
Magnitude 3.0 et plus| Date | Heure | Ordre de grandeur | Distance | Profondeur | Lieu | Lien |
|---|---|---|---|---|---|---|
| 28/07/2019 | 14:25 | 4,1 | 74,5 km | 10 000 m | 18km ENE of Kenda, India | usgs.gov |
| 25/05/2019 | 22:09 | 4,7 | 90,5 km | 10 000 m | 18km WSW of Bankura, India | usgs.gov |
| 25/03/2009 | 21:44 | 4,1 | 63,7 km | 10 000 m | Jharkhand, India | usgs.gov |
| 19/10/2003 | 17:39 | 4,3 | 56,7 km | 33 000 m | Jharkhand-West Bengal border region, India | usgs.gov |
| 16/05/1993 | 02:05 | 4,6 | 96,5 km | 33 000 m | Jharkhand-West Bengal border region, India | usgs.gov |
À propos de nos données
Les données de cette page sont estimées à l'aide d'un certain nombre d'outils et de ressources accessibles au public. Il est fourni sans garantie et peut contenir des inexactitudes. À utiliser à vos risques et périls. Voir ici pour plus d'informations.