Catégories à Aurangabad
les industries
Répartition des entreprises par secteur à Aurangabad
| Description de l'industrie | Nombre d'établissements | Âge moyen des entreprises | Évaluation Google moyenne |
|---|---|---|---|
| Shopping | 11,663 | 35 years | 4.1 |
| Épiceries et supermarchés | 2,056 | — | 4 |
| Shopping Autres | 1,738 | — | 3.9 |
| Toute l'alimentation et les boissons | 1,511 | — | 4 |
| Santé et médecine | 1,508 | — | 4.2 |
| Magasin de bricolage | 1,178 | — | 4.2 |
| Boutiques de vêtements | 1,177 | — | 4 |
| Réparations de voitures | 1,119 | — | 3.9 |
| Boutiques d'appareils électroniques | 940 | 41 years | 4.1 |
| Pharmacies | 915 | — | 4.5 |
| Restaurants | 865 | — | 3.9 |
| Éducation | 856 | — | 4 |
| Sociétés de Prêt | 832 | — | 3.9 |
| Appareils et articles ménagers | 666 | — | 4.2 |
| Vente en gros de machines | 644 | 33 years | 4.3 |
| Hôpitaux | 631 | — | 4.1 |
| Pièces Auto | 627 | — | 4 |
| Vente en gros de matériaux de construction | 621 | 38 years | 4.2 |
| Instituts de beauté | 609 | — | 3.9 |
| Religion | 580 | — | 4.5 |
| Entrepreneurs Généraux | 510 | — | 4.2 |
| Autres activités d’hébergement | 483 | — | 3.9 |
| Vêtements pour femme | 466 | — | 4 |
| Bijouterie | 455 | — | 4.3 |
| Salons de coiffure | 445 | — | 3.8 |
Faits sur Aurangabad
| Région | 87.4 km² |
| Population | 1 478 001 |
| Population masculine | 770 398 (52.1%) |
| Population féminine | 707 603 (47.9%) |
| Variation de la population (1975 to 2020) | +172.8% |
| Variation de la population (2000 to 2020) | +33.7% |
| Age moyen | 24.5 ans (Hommes : 23.8, Femmes : 25.2) |
| Voisinages | Waluj, Samarth Nagar, MIDC, Waluj, New Usmanpura, MIDC Industrial Area, Chilkalthana |
| Heure locale | |
| Fuseau horaire | heure de l’Inde |
| Lat. et long. | 19.87757, 75.34226 |
| Codes Postaux | 423702, 431001, 431003, 431004, 431005, More |
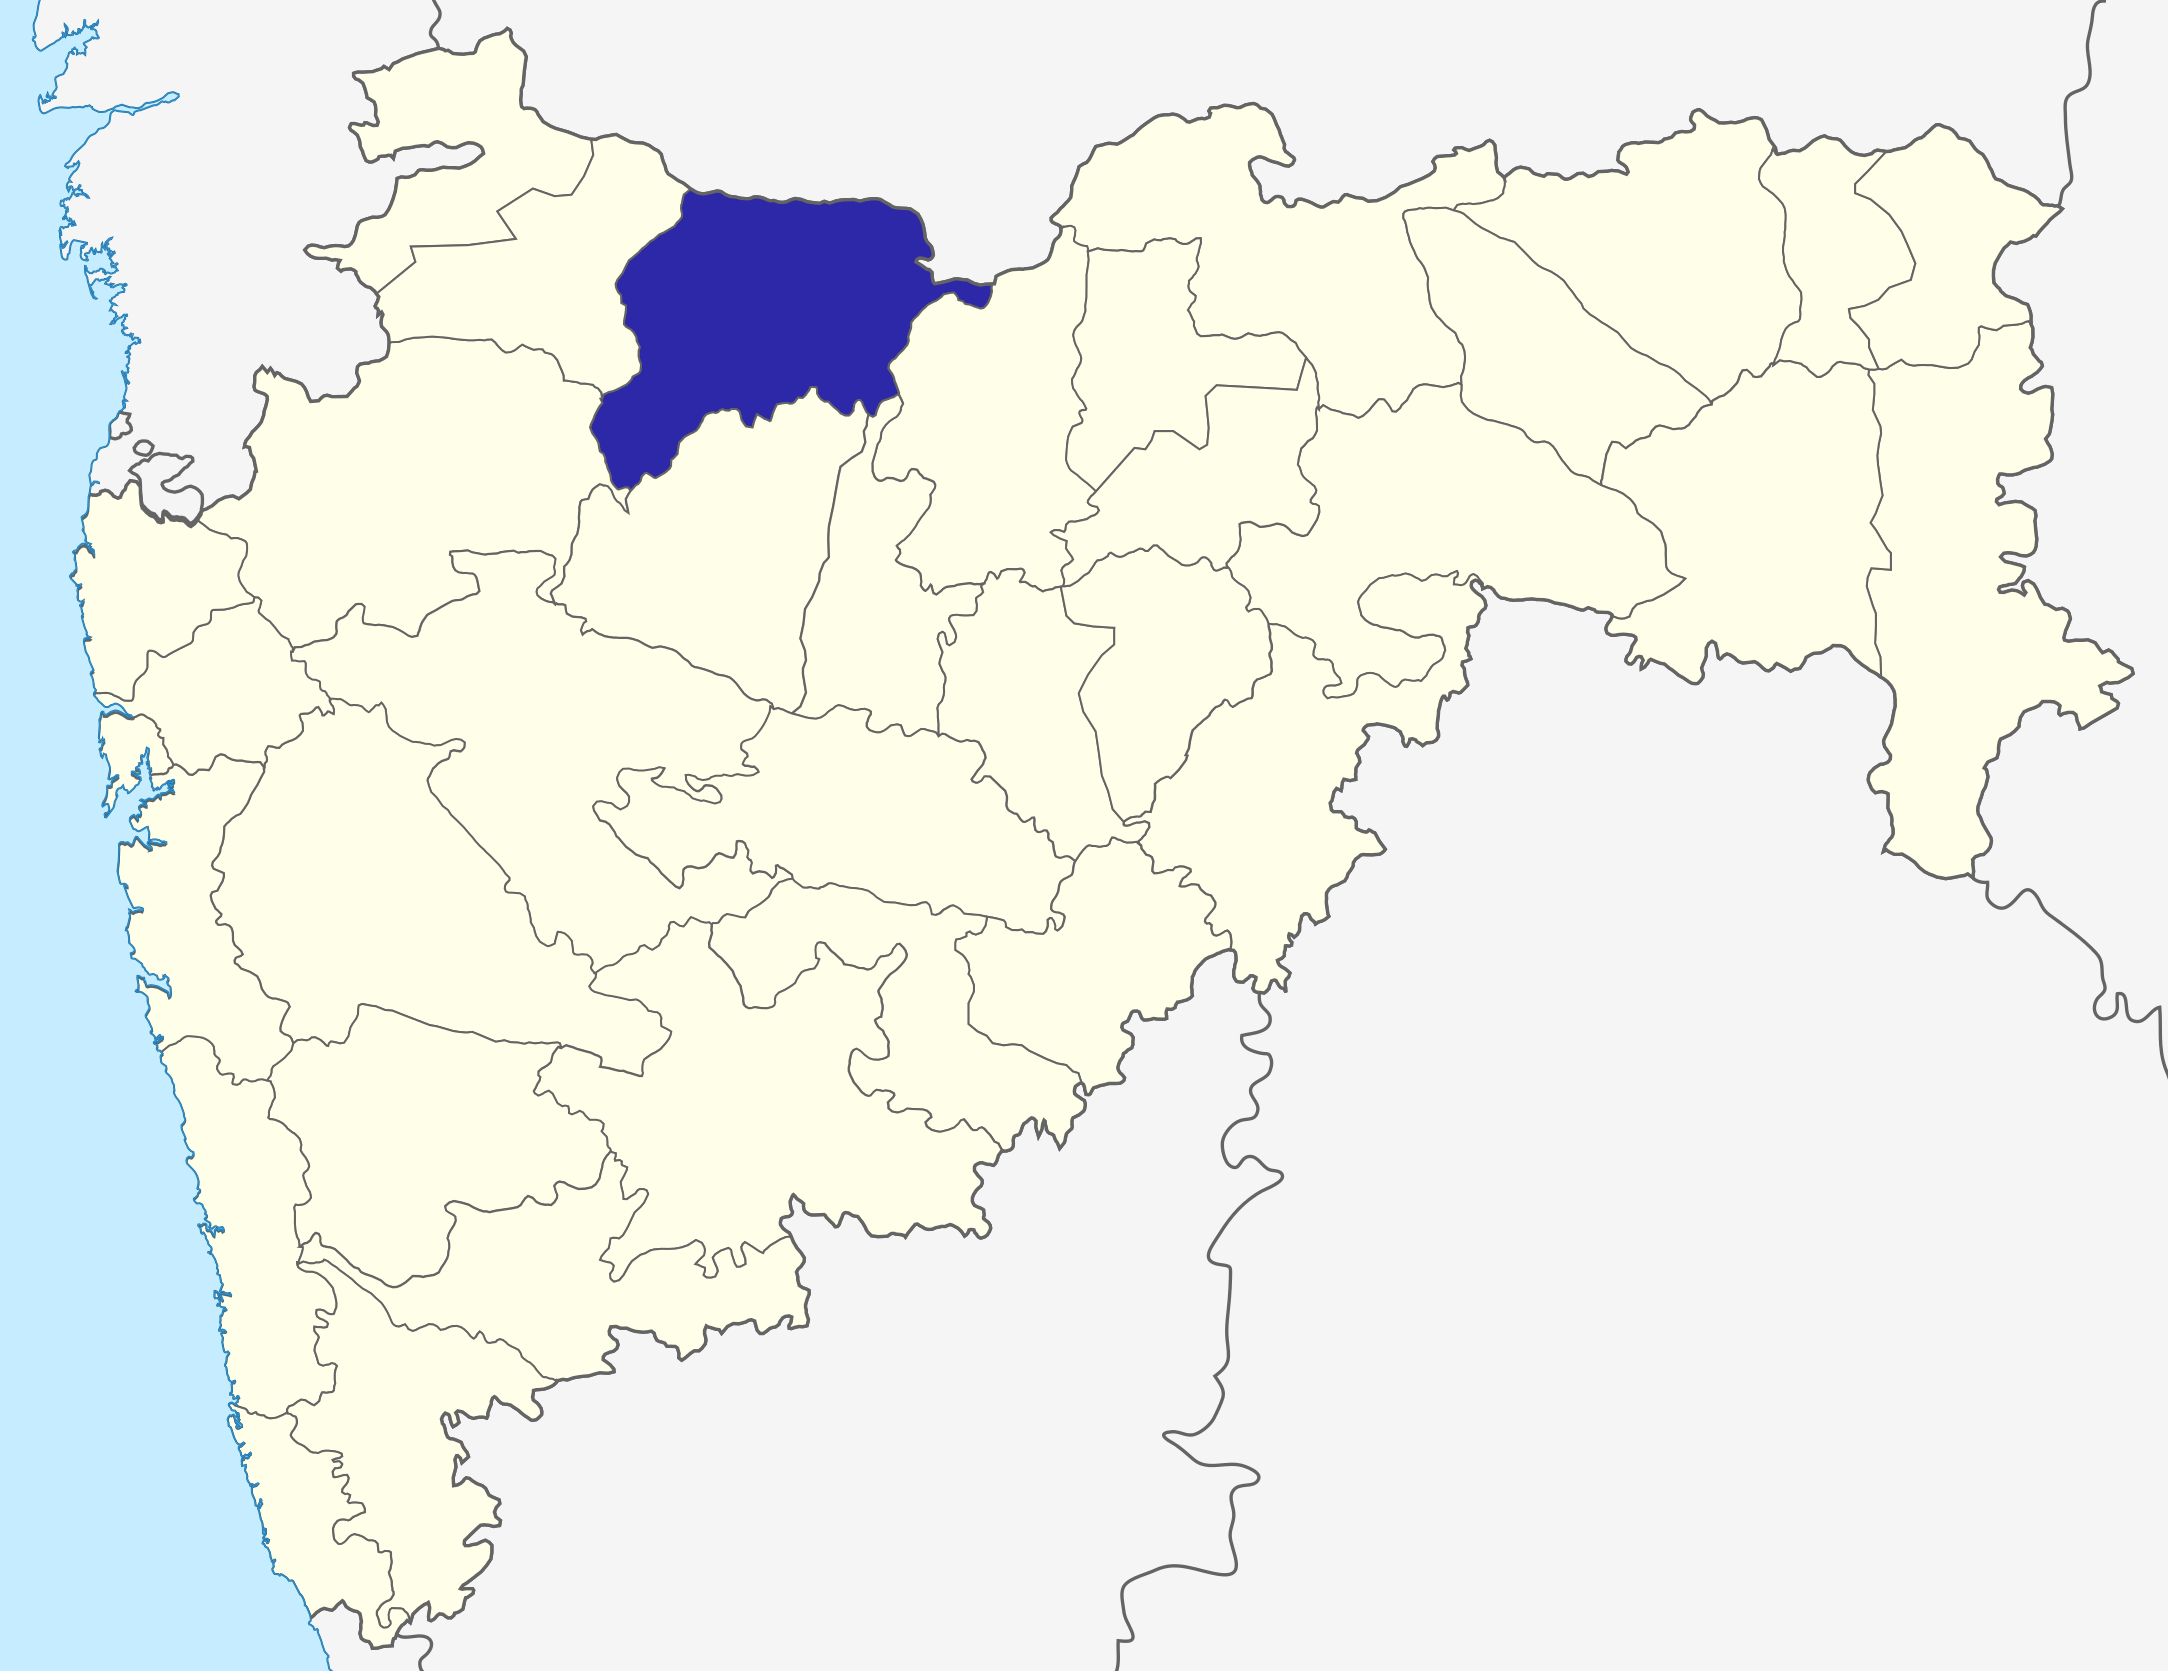
Carte de Aurangabad
Carte interactive
Population de Aurangabad
Années 1975 à 2020
| Data | 1975 | 1990 | 2000 | 2015 | 2020 |
|---|---|---|---|---|---|
| Population | 541 797 | 859 152 | 1 105 660 | 1 396 844 | 1 478 001 |
| Densité de population | 6 200,8 / km² | 9 832,9 / km² | 12 654,2 / km² | 15 986,8 / km² | 16 915,6 / km² |
Variation de la population de Aurangabad de 2000 à 2015
Augmentation de 26.3% de l'année 2000 à 2015
| Lieu | Variation depuis 1975 | Variation depuis 1990 | Variation depuis 2000 |
|---|---|---|---|
| Aurangabad | +157.8% | +62.6% | +26.3% |
| Maharashtra | +98% | +45.2% | +21.9% |
| Inde | +111.1% | +50.6% | +24.5% |
Âge médian de Aurangabad
Âge médian : 24.5 ans
| Lieu | Age moyen | Âge médian (femme) | Âge médian (masculin) |
|---|---|---|---|
| Aurangabad | 24.5 yrs | 25.2 yrs | 23.8 yrs |
| Maharashtra | 27.2 yrs | 27.8 yrs | 26.6 yrs |
| Inde | 24.9 yrs | 25.4 yrs | 24.5 yrs |
Densité de population de Aurangabad
Densité de population : 16 916 / km²
| Lieu | Population | Région | Densité |
|---|---|---|---|
| Aurangabad | 1,5 million | 87,4 km² | 16 916 / km² |
| Maharashtra | 120,6 million | 307 683,7 km² | 392 / km² |
| Inde | 1 307 million | 3 083 563,4 km² | 424 / km² |
Population historique et projetée de Aurangabad
Population estimée de 1780 à 2100
- JRC (European Commission's Joint Research Centre) travailler sur GHS built-up grid
- CIESIN (Center for International Earth Science Information Network)
- [Lien] Klein Goldewijk, K., Beusen, A., Doelman, J., and Stehfest, E.: Anthropogenic land use estimates for the Holocene – HYDE 3.2, Earth Syst. Sci. Data, 9, 927–953, https://doi.org/10.5194/essd-9-927-2017, 2017.
Quartiers à Aurangabad
Pourcentage d'entreprises par quartier à Aurangabad
Codes Téléphone
Pourcentage des indicatifs régionaux utilisés par les entreprises de Aurangabad
Codes Postaux
Pourcentage d'entreprises par code postal à Aurangabad
Distribution des prix
Répartition des activités par prix pour Aurangabad
Indice de développement humain (IDH)
Indice composite statistique de l'espérance de vie, de l'éducation et du revenu par habitant.
Émissions de CO2 de Aurangabad
Émissions de dioxyde de carbone (CO2) par habitant en tonnes par an
| Lieu | Emissions de CO2 | Émissions de CO2 par habitant | Intensité des émissions de CO2 |
|---|---|---|---|
| Aurangabad | 2,864,302 tn | 1.94 tn | 32,781.7 tons/km² |
| Maharashtra | 206,036,744 tn | 1.71 tn | 669.6 tons/km² |
| Inde | 1,928,568,344 tn | 1.48 tn | 625.4 tons/km² |
| Émissions de CO2 en 2013 (tonnes/an) | 2,864,302 tn |
| Émissions de CO2 en 2013 (tonnes/an) par habitant | 1.94 tn |
| Intensité des émissions de CO2 en 2013 (tonnes/km²/an) | 32,781.7 tons/km² |
Risque de dangers naturels
Relative risk out of 10
| Danger | Risk Level |
|---|---|
| Drought | High (8) |
| Flood | Medium (4) |
* Risk, particularly concerning flood or landslide, may not be for the entire area.
- Dilley, M., R.S. Chen, U. Deichmann, A.L. Lerner-Lam, M. Arnold, J. Agwe, P. Buys, O. Kjekstad, B. Lyon, and G. Yetman. 2005. Natural Disaster Hotspots: A Global Risk Analysis. Washington, D.C.: World Bank. https://doi.org/10.1596/0-8213-5930-4.
- Center for Hazards and Risk Research - CHRR - Columbia University, Center for International Earth Science Information Network - CIESIN - Columbia University, and International Research Institute for Climate and Society - IRI - Columbia University. 2005. Global Drought Hazard Frequency and Distribution. Palisades, NY: NASA Socioeconomic Data and Applications Center (SEDAC). https://doi.org/10.7927/H4VX0DFT.
- Center for Hazards and Risk Research - CHRR - Columbia University, Center for International Earth Science Information Network - CIESIN - Columbia University. 2005. Global Flood Hazard Frequency and Distribution. Palisades, NY: NASA Socioeconomic Data and Applications Center (SEDAC). https://doi.org/10.7927/H4668B3D.
Aurangabad
Aurangabad (en marathi औरंगाबाद (Auraṅgābād), du persan اورنگآباد signifiant « construit par le trône ») est une ville et chef-lieu du district d'Aurangabad dans le Maharashtra en Inde.
Page Wikipédia de Aurangabad


À propos de nos données
Les données de cette page sont estimées à l'aide de divers outils et ressources accessibles au public. Elles sont fournies sans garantie et peuvent contenir des inexactitudes. Utilisez-les à vos risques et périls.