Catégories à Tondano
les industries
Répartition des entreprises par secteur à Tondano
| Description de l'industrie | Nombre d'établissements |
|---|---|
| Shopping | 333 |
| Restaurants | 261 |
| Autres activités d’hébergement | 166 |
| Religion | 157 |
| Cafés | 132 |
| Éducation | 117 |
| Églises | 103 |
| Voyages et transports | 80 |
| Épiceries et supermarchés | 70 |
| Administration publique | 57 |
| Instituts de beauté | 51 |
| Boutiques de vêtements | 50 |
| Gestion d'entreprise | 43 |
Faits sur Tondano
| Région | 193.4 km² |
| Population | 132 433 |
| Population masculine | 67 697 (51.1%) |
| Population féminine | 64 736 (48.9%) |
| Variation de la population (1975 to 2020) | +265.3% |
| Variation de la population (2000 to 2020) | +50.4% |
| Age moyen | 31.3 ans (Hommes : 30.9, Femmes : 31.8) |
| PIB par habitant (PPA) | $14 296 (2022) |
| Codes Téléphone | 4 |
| Voisinages | Kembuan, Tondano Utara, Toulour, Tondano Timur, Tondano, Ranowangko, Tondano Timur, Kembuan, Tondano |
| Heure locale | |
| Fuseau horaire | heure du Centre indonésien |
| Lat. et long. | 1.30540, 124.91261 |
| Codes Postaux | 95611, 95612, 95613, 95614, 95615, More |
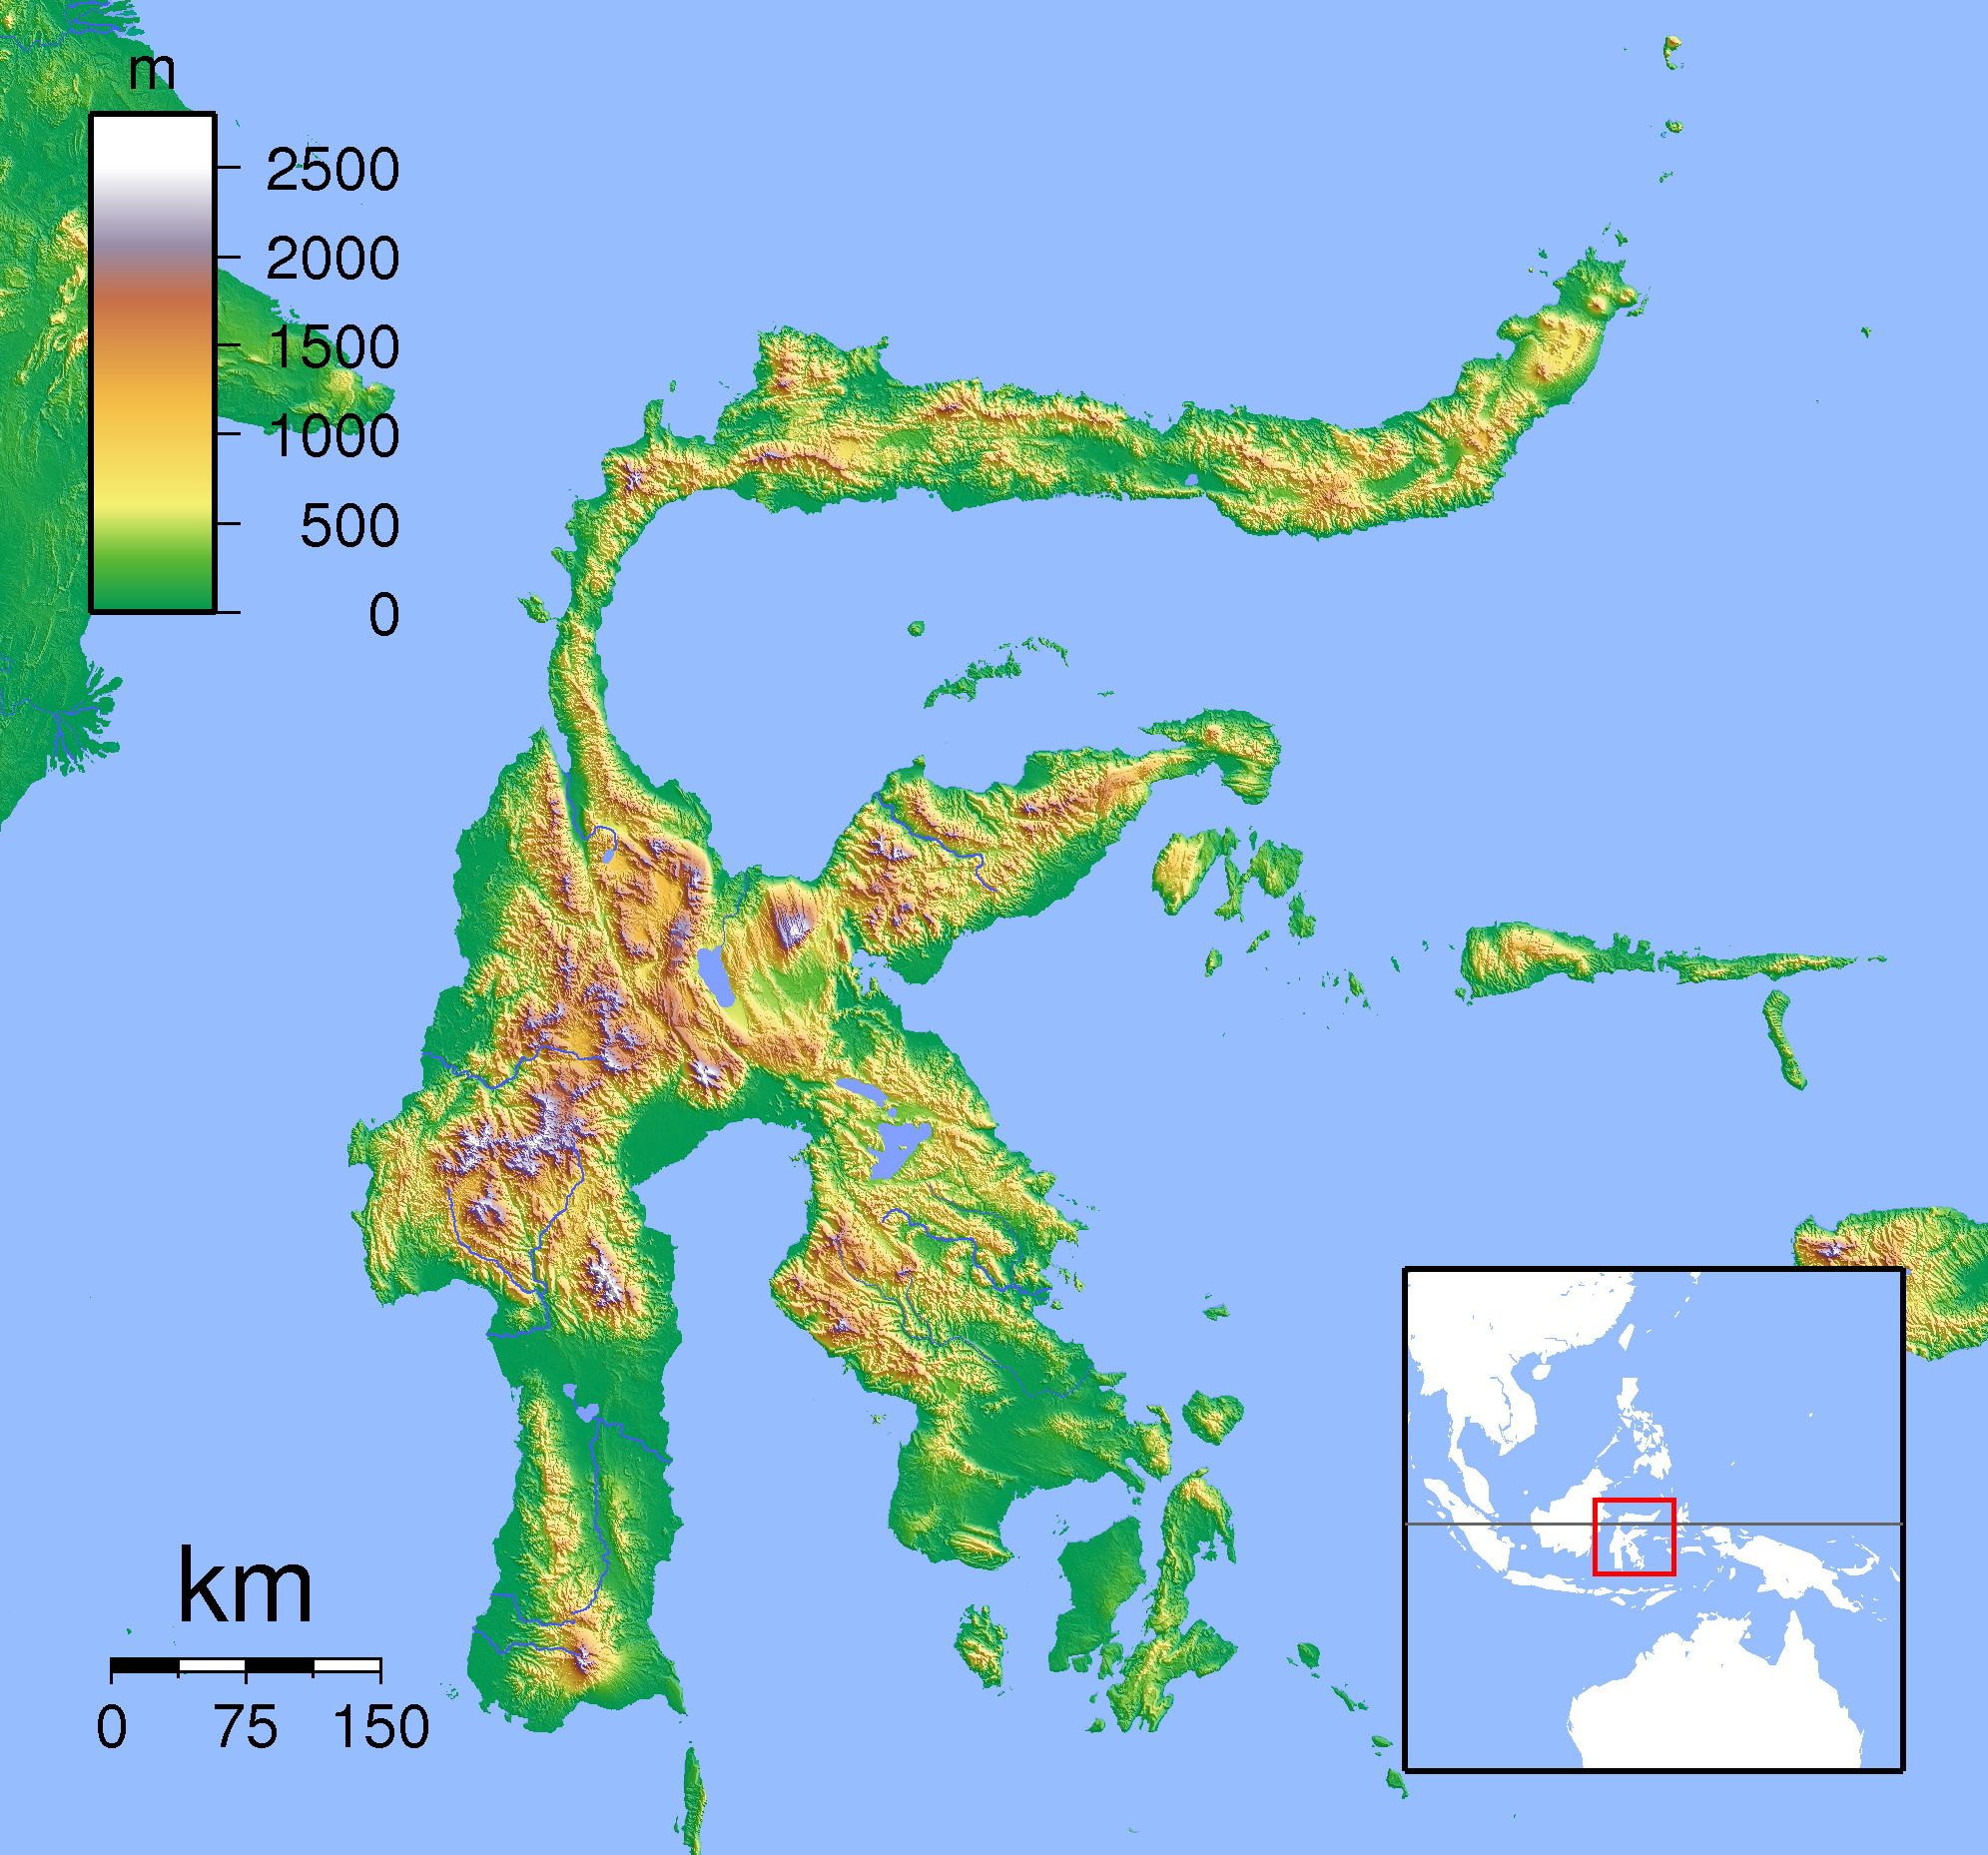
Carte de Tondano
Carte interactive
Population de Tondano
Années 1975 à 2030
| Data | 1975 | 1990 | 2000 | 2015 | 2020 | 2025* | 2030* |
|---|---|---|---|---|---|---|---|
| Population | 36 250 | 65 831 | 88 053 | 127 225 | 132 433 | 136 805 | 141 701 |
| Densité de population | 187,5 / km² | 340,4 / km² | 455,3 / km² | 657,9 / km² | 684,9 / km² | 707,5 / km² | 732,8 / km² |
Variation de la population de Tondano de 2000 à 2020
Augmentation de 50.4% de l'année 2000 à 2020
| Lieu | Variation depuis 1975 | Variation depuis 1990 | Variation depuis 2000 |
|---|---|---|---|
| Tondano | +265.3% | +101.2% | +50.4% |
| Sulawesi du Nord | — | — | — |
| Indonésie | — | — | — |
Âge médian de Tondano
Âge médian : 31.3 ans
| Lieu | Age moyen | Âge médian (femme) | Âge médian (masculin) |
|---|---|---|---|
| Tondano | 31.3 yrs | 31.8 yrs | 30.9 yrs |
| Sulawesi du Nord | 29.1 yrs | 29.5 yrs | 28.7 yrs |
| Indonésie | 27.2 yrs | 27.5 yrs | 26.9 yrs |
Densité de population de Tondano
Densité de population : 685 / km²
| Lieu | Population | Région | Densité |
|---|---|---|---|
| Tondano | 132 433 | 193,4 km² | 685 / km² |
| Sulawesi du Nord | 2,4 million | 14 665,5 km² | 161 / km² |
| Indonésie | 252,8 million | 1 893 657,8 km² | 134 / km² |
Population historique et projetée de Tondano
Population estimée de 1860 à 2100
- JRC (European Commission's Joint Research Centre) travailler sur GHS built-up grid
- CIESIN (Center for International Earth Science Information Network)
- [Lien] Klein Goldewijk, K., Beusen, A., Doelman, J., and Stehfest, E.: Anthropogenic land use estimates for the Holocene – HYDE 3.2, Earth Syst. Sci. Data, 9, 927–953, https://doi.org/10.5194/essd-9-927-2017, 2017.
Quartiers à Tondano
Pourcentage d'entreprises par quartier à Tondano
Codes Téléphone
Pourcentage des indicatifs régionaux utilisés par les entreprises de Tondano
Distribution des prix
Répartition des activités par prix pour Tondano
Indice de développement humain (IDH)
Indice composite statistique de l'espérance de vie, de l'éducation et du revenu par habitant.
Produit intérieur brut (PIB) de Tondano
PIB par habitant, PPA (dollars internationaux constants de 2017)
| Data | 1990 | 1995 | 2000 | 2005 | 2010 | 2015 | 2020 | 2022 |
|---|---|---|---|---|---|---|---|---|
| PIB par habitant | $4 467 | $5 546 | $5 561 | $5 749 | $8 512 | $10 736 | $13 679 | $14 296 |
| PIB total | $392 M | $549,5 M | $627,1 M | $750,4 M | $1,3 Md | $1,8 Md | $2,4 Md | $2,5 Md |
Émissions de CO2 de Tondano
Émissions de dioxyde de carbone (CO2) par habitant en tonnes par an
| Lieu | Emissions de CO2 | Émissions de CO2 par habitant | Intensité des émissions de CO2 |
|---|---|---|---|
| Tondano | 301,532 tn | 2.28 tn | 1,559.3 tons/km² |
| Sulawesi du Nord | 4,296,994 tn | 1.82 tn | 293 tons/km² |
| Indonésie | 478,610,416 tn | 1.89 tn | 252.7 tons/km² |
| Émissions de CO2 en 2013 (tonnes/an) | 301,532 tn |
| Émissions de CO2 en 2013 (tonnes/an) par habitant | 2.28 tn |
| Intensité des émissions de CO2 en 2013 (tonnes/km²/an) | 1,559.3 tons/km² |
Risque de dangers naturels
Risque relatif sur 10
| Danger | Niveau de risque |
|---|---|
| Sécheresse | Élevé (7.1) |
| Inonder | Moyen (4) |
| Tremblement de terre | Moyen (5.5) |
| Glissement de terrain | Élevé (8) |
| Volcan | Élevé (9) |
* Les risques, en particulier concernant les inondations ou les glissements de terrain, peuvent ne pas concerner toute la zone.
- Dilley, M., R.S. Chen, U. Deichmann, A.L. Lerner-Lam, M. Arnold, J. Agwe, P. Buys, O. Kjekstad, B. Lyon, and G. Yetman. 2005. Natural Disaster Hotspots: A Global Risk Analysis. Washington, D.C.: World Bank. https://doi.org/10.1596/0-8213-5930-4.
- Center for Hazards and Risk Research - CHRR - Columbia University, Center for International Earth Science Information Network - CIESIN - Columbia University, and Norwegian Geotechnical Institute - NGI. 2005. Global Landslide Hazard Distribution. Palisades, NY: NASA Socioeconomic Data and Applications Center (SEDAC). https://doi.org/10.7927/H4P848VZ.
- Center for Hazards and Risk Research - CHRR - Columbia University, Center for International Earth Science Information Network - CIESIN - Columbia University, and International Research Institute for Climate and Society - IRI - Columbia University. 2005. Global Drought Hazard Frequency and Distribution. Palisades, NY: NASA Socioeconomic Data and Applications Center (SEDAC). https://doi.org/10.7927/H4VX0DFT.
- Center for Hazards and Risk Research - CHRR - Columbia University, Center for International Earth Science Information Network - CIESIN - Columbia University. 2005. Global Flood Hazard Frequency and Distribution. Palisades, NY: NASA Socioeconomic Data and Applications Center (SEDAC). https://doi.org/10.7927/H4668B3D.
- Center for Hazards and Risk Research - CHRR - Columbia University, Center for International Earth Science Information Network - CIESIN - Columbia University. 2005. Global Volcano Hazard Frequency and Distribution. Palisades, NY: NASA Socioeconomic Data and Applications Center (SEDAC). https://doi.org/10.7927/H4BR8Q45.
- Center for Hazards and Risk Research - CHRR - Columbia University, Center for International Earth Science Information Network - CIESIN - Columbia University. 2005. Global Earthquake Hazard Distribution - Peak Ground Acceleration. Palisades, NY: NASA Socioeconomic Data and Applications Center (SEDAC). https://doi.org/10.7927/H4BZ63ZS.
Tremblements de terre récents à proximité
Magnitude 3.0 et plus
| Date▼ | Heure↕ | Magnitude↕ | Distance↕ | Profondeur↕ | Lieu↕ | Lien |
|---|---|---|---|---|---|---|
| 4/18/19 | 9:31 PM | 4.5 | 52.7 km | 170,050 m | 25km N of Bitung, Indonesia | usgs.gov |
| 10/13/18 | 4:34 AM | 5.2 | 49.9 km | 97,150 m | 16km ENE of Bitung, Indonesia | usgs.gov |
| 7/13/18 | 2:29 AM | 4.6 | 44.8 km | 227,990 m | 36km W of Tomohon, Indonesia | usgs.gov |
| 4/2/18 | 7:23 PM | 4.6 | 37.4 km | 193,710 m | 17km NNW of Laikit, Laikit II (Dimembe), Indonesia | usgs.gov |
| 8/21/17 | 11:31 PM | 4.5 | 27.6 km | 134,190 m | 27km S of Tondano, Indonesia | usgs.gov |
| 10/10/16 | 8:24 AM | 4.1 | 36.7 km | 550,800 m | 15km N of Manado, Indonesia | usgs.gov |
| 9/27/16 | 9:35 AM | 4.1 | 14.8 km | 35,000 m | 6km WNW of Tomohon, Indonesia | usgs.gov |
| 7/27/16 | 7:16 PM | 4.5 | 50.7 km | 232,880 m | 29km NNW of Manado, Indonesia | usgs.gov |
| 7/27/16 | 9:53 AM | 4.2 | 53.5 km | 234,150 m | 42km NNE of Poigar, Indonesia | usgs.gov |
| 6/1/16 | 7:12 PM | 4.2 | 40.7 km | 153,380 m | 19km N of Manado, Indonesia | usgs.gov |

À propos de nos données
Les données de cette page sont estimées à l'aide de divers outils et ressources accessibles au public. Elles sont fournies sans garantie et peuvent contenir des inexactitudes. Utilisez-les à vos risques et périls.