Catégories à Padang
les industries
Répartition des entreprises par secteur à Padang
| Description de l'industrie | Nombre d'établissements | Âge moyen des entreprises |
|---|---|---|
| Shopping | 13,348 | 22 years |
| Restaurants | 8,339 | — |
| Cafés | 6,840 | — |
| Gestion d'entreprise | 3,489 | — |
| Boutiques de vêtements | 3,487 | — |
| Éducation | 3,453 | 33 years |
| Religion | 2,720 | — |
| Épiceries et supermarchés | 2,374 | — |
| Boutiques d'appareils électroniques | 2,371 | — |
| Autres activités d’hébergement | 2,145 | — |
| Réparations de voitures | 2,115 | — |
| Voyages et transports | 2,031 | — |
| Toute l'alimentation et les boissons | 1,580 | — |
Faits sur Padang
| Région | 310.2 km² |
| Population | 1 179 794 |
| Population masculine | 587 169 (49.8%) |
| Population féminine | 592 625 (50.2%) |
| Variation de la population (1975 to 2020) | +132.0% |
| Variation de la population (2000 to 2020) | +35.2% |
| Age moyen | 24.8 ans (Hommes : 24.6, Femmes : 25.2) |
| PIB par habitant (PPA) | $16 842 (2022) |
| Codes Téléphone | 75, 77 |
| Voisinages | Olo, Padang Barat, Kampung Jao, Padang Barat, Belakang Tangsi, Padang Barat, Padang Pasir, Padang Barat, Purus, Padang Barat |
| Heure locale | |
| Fuseau horaire | heure de l’Ouest indonésien |
| Lat. et long. | -0.94924, 100.35427 |
| Codes Postaux | 25111, 25112, 25113, 25114, 25115, More |
Carte de Padang
Carte interactive
Population de Padang
Années 1975 à 2030
| Data | 1975 | 1990 | 2000 | 2015 | 2020 | 2025* | 2030* |
|---|---|---|---|---|---|---|---|
| Population | 508 479 | 732 306 | 872 756 | 1 021 803 | 1 179 794 | 1 243 006 | 1 321 687 |
| Densité de population | 1 639,3 / km² | 2 360,8 / km² | 2 813,6 / km² | 3 294,1 / km² | 3 803,5 / km² | 4 007,3 / km² | 4 260,9 / km² |
Variation de la population de Padang de 2000 à 2020
Augmentation de 35.2% de l'année 2000 à 2020
| Lieu | Variation depuis 1975 | Variation depuis 1990 | Variation depuis 2000 |
|---|---|---|---|
| Padang | +132% | +61.1% | +35.2% |
| Sumatra occidental | — | — | — |
| Indonésie | — | — | — |
Âge médian de Padang
Âge médian : 24.8 ans
| Lieu | Age moyen | Âge médian (femme) | Âge médian (masculin) |
|---|---|---|---|
| Padang | 24.8 yrs | 25.2 yrs | 24.6 yrs |
| Sumatra occidental | 26.8 yrs | 28.2 yrs | 25.4 yrs |
| Indonésie | 27.2 yrs | 27.5 yrs | 26.9 yrs |
Densité de population de Padang
Densité de population : 3 804 / km²
| Lieu | Population | Région | Densité |
|---|---|---|---|
| Padang | 1,2 million | 310,2 km² | 3 804 / km² |
| Sumatra occidental | 21 004 | 50,2 km² | 419 / km² |
| Indonésie | 252,8 million | 1 893 657,8 km² | 134 / km² |
Population historique et projetée de Padang
Population estimée de 1860 à 2100
- JRC (European Commission's Joint Research Centre) travailler sur GHS built-up grid
- CIESIN (Center for International Earth Science Information Network)
- [Lien] Klein Goldewijk, K., Beusen, A., Doelman, J., and Stehfest, E.: Anthropogenic land use estimates for the Holocene – HYDE 3.2, Earth Syst. Sci. Data, 9, 927–953, https://doi.org/10.5194/essd-9-927-2017, 2017.
Quartiers à Padang
Pourcentage d'entreprises par quartier à Padang
Codes Téléphone
Pourcentage des indicatifs régionaux utilisés par les entreprises de Padang
Codes Postaux
Pourcentage d'entreprises par code postal à Padang
Distribution des prix
Répartition des activités par prix pour Padang
Indice de développement humain (IDH)
Indice composite statistique de l'espérance de vie, de l'éducation et du revenu par habitant.
Produit intérieur brut (PIB) de Padang
PIB par habitant, PPA (dollars internationaux constants de 2017)
| Data | 1990 | 1995 | 2000 | 2005 | 2010 | 2015 | 2020 | 2022 |
|---|---|---|---|---|---|---|---|---|
| PIB par habitant | $7 947 | $10 461 | $8 987 | $9 612 | $11 203 | $14 957 | $15 203 | $16 842 |
| PIB total | $7,3 Md | $10,3 Md | $9,2 Md | $10,2 Md | $13,1 Md | $18,6 Md | $20,3 Md | $23,1 Md |
Émissions de CO2 de Padang
Émissions de dioxyde de carbone (CO2) par habitant en tonnes par an
| Lieu | Emissions de CO2 | Émissions de CO2 par habitant | Intensité des émissions de CO2 |
|---|---|---|---|
| Padang | 2,123,473 tn | 1.8 tn | 6,845.8 tons/km² |
| Sumatra occidental | 39,808 tn | 1.9 tn | 793.7 tons/km² |
| Indonésie | 478,610,416 tn | 1.89 tn | 252.7 tons/km² |
| Émissions de CO2 en 2013 (tonnes/an) | 2,123,473 tn |
| Émissions de CO2 en 2013 (tonnes/an) par habitant | 1.8 tn |
| Intensité des émissions de CO2 en 2013 (tonnes/km²/an) | 6,845.8 tons/km² |
Risque de dangers naturels
Risque relatif sur 10
| Danger | Niveau de risque |
|---|---|
| Sécheresse | Faible (2) |
| Inonder | Moyen (7) |
| Tremblement de terre | Moyen (7) |
| Glissement de terrain | Élevé (10) |
| Volcan | Moyen (5) |
* Les risques, en particulier concernant les inondations ou les glissements de terrain, peuvent ne pas concerner toute la zone.
- Dilley, M., R.S. Chen, U. Deichmann, A.L. Lerner-Lam, M. Arnold, J. Agwe, P. Buys, O. Kjekstad, B. Lyon, and G. Yetman. 2005. Natural Disaster Hotspots: A Global Risk Analysis. Washington, D.C.: World Bank. https://doi.org/10.1596/0-8213-5930-4.
- Center for Hazards and Risk Research - CHRR - Columbia University, Center for International Earth Science Information Network - CIESIN - Columbia University, and Norwegian Geotechnical Institute - NGI. 2005. Global Landslide Hazard Distribution. Palisades, NY: NASA Socioeconomic Data and Applications Center (SEDAC). https://doi.org/10.7927/H4P848VZ.
- Center for Hazards and Risk Research - CHRR - Columbia University, Center for International Earth Science Information Network - CIESIN - Columbia University, and International Research Institute for Climate and Society - IRI - Columbia University. 2005. Global Drought Hazard Frequency and Distribution. Palisades, NY: NASA Socioeconomic Data and Applications Center (SEDAC). https://doi.org/10.7927/H4VX0DFT.
- Center for Hazards and Risk Research - CHRR - Columbia University, Center for International Earth Science Information Network - CIESIN - Columbia University. 2005. Global Flood Hazard Frequency and Distribution. Palisades, NY: NASA Socioeconomic Data and Applications Center (SEDAC). https://doi.org/10.7927/H4668B3D.
- Center for Hazards and Risk Research - CHRR - Columbia University, Center for International Earth Science Information Network - CIESIN - Columbia University. 2005. Global Volcano Hazard Frequency and Distribution. Palisades, NY: NASA Socioeconomic Data and Applications Center (SEDAC). https://doi.org/10.7927/H4BR8Q45.
- Center for Hazards and Risk Research - CHRR - Columbia University, Center for International Earth Science Information Network - CIESIN - Columbia University. 2005. Global Earthquake Hazard Distribution - Peak Ground Acceleration. Palisades, NY: NASA Socioeconomic Data and Applications Center (SEDAC). https://doi.org/10.7927/H4BZ63ZS.
Tremblements de terre récents à proximité
Magnitude 3.0 et plus
| Date▼ | Heure↕ | Magnitude↕ | Distance↕ | Profondeur↕ | Lieu↕ | Lien |
|---|---|---|---|---|---|---|
| 7/24/19 | 3:01 PM | 4 | 23.3 km | 100,640 m | 11km SSW of Lubukalung, Indonesia | usgs.gov |
| 6/4/19 | 7:18 AM | 4.6 | 17.8 km | 96,990 m | 10km WNW of Tabing, Indonesia | usgs.gov |
| 2/4/19 | 6:57 AM | 4.8 | 40.5 km | 97,450 m | 13km WSW of Alahanpanjang, Indonesia | usgs.gov |
| 7/21/18 | 7:58 AM | 5.2 | 46.2 km | 10,000 m | 9km S of Sirukam, Indonesia | usgs.gov |
| 4/15/18 | 12:23 PM | 4.2 | 33.7 km | 90,760 m | 33km SW of Padang, Indonesia | usgs.gov |
| 12/22/17 | 10:26 AM | 4.1 | 48.4 km | 75,920 m | 7km SW of Alahanpanjang, Indonesia | usgs.gov |
| 5/2/17 | 10:16 AM | 4 | 49.3 km | 36,300 m | 49km WSW of Padang, Indonesia | usgs.gov |
| 10/20/15 | 11:57 PM | 4.3 | 53.5 km | 95,890 m | 4km WSW of Talawi, Indonesia | usgs.gov |
| 7/25/15 | 1:17 PM | 3.7 | 54.1 km | 10,000 m | 6km SW of Saruaso, Indonesia | usgs.gov |
| 1/12/15 | 1:45 AM | 4.3 | 28.3 km | 104,070 m | 25km SSW of Pauhambar, Indonesia | usgs.gov |
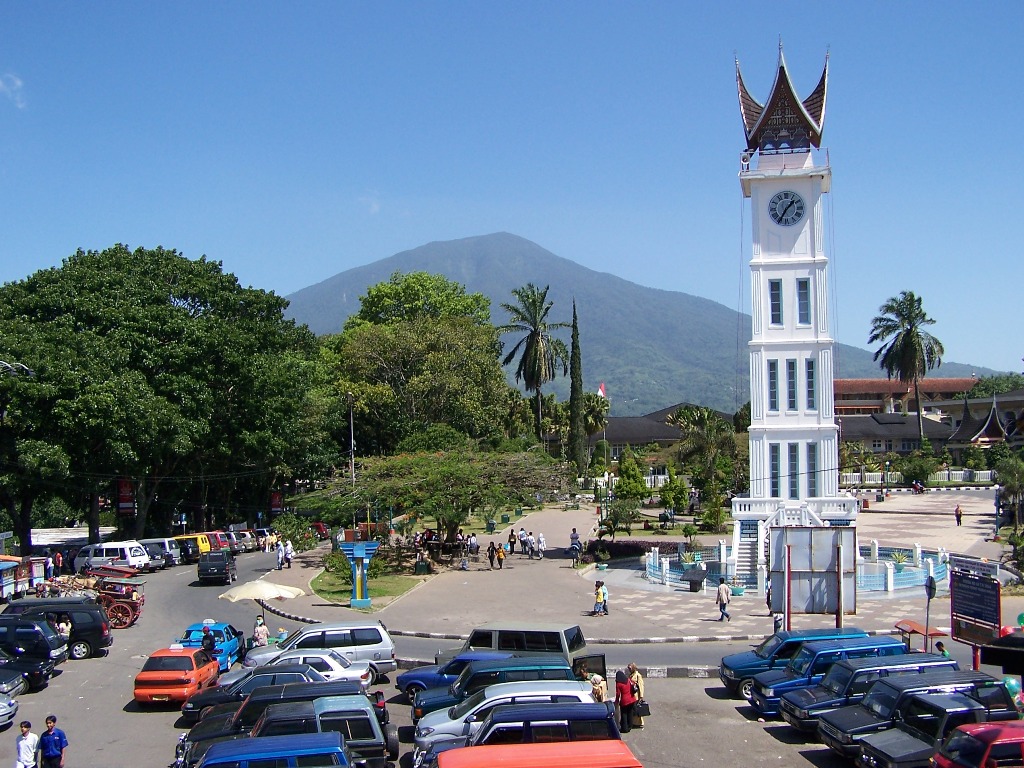
Padang
est une ville d'Indonésie dans l'île de Sumatra. C'est la capitale de la province de Sumatra occidental. Elle a le statut de kota. ville est le siège du Diocèse de
Page Wikipédia de Padang


À propos de nos données
Les données de cette page sont estimées à l'aide de divers outils et ressources accessibles au public. Elles sont fournies sans garantie et peuvent contenir des inexactitudes. Utilisez-les à vos risques et périls.