Catégories à Indramayu
les industries
Répartition des entreprises par secteur à Indramayu
| Description de l'industrie | Nombre d'établissements | Âge moyen des entreprises |
|---|---|---|
| Shopping | 10,936 | — |
| Restaurants | 5,212 | — |
| Cafés | 3,954 | — |
| Éducation | 3,037 | 41 years |
| Épiceries et supermarchés | 2,791 | — |
| Religion | 2,723 | — |
| Boutiques de vêtements | 2,052 | — |
| Mosquées | 1,769 | — |
| Autres activités d’hébergement | 1,682 | — |
| Gestion d'entreprise | 1,585 | — |
| Boutiques d'appareils électroniques | 1,350 | — |
| Toute l'alimentation et les boissons | 1,144 | — |
Faits sur Indramayu
| Région | 535.3 km² |
| Population | 939 100 |
| Population masculine | 483 532 (51.5%) |
| Population féminine | 455 568 (48.5%) |
| Variation de la population (1975 to 2020) | +61.8% |
| Variation de la population (2000 to 2020) | +16.3% |
| Age moyen | 28.7 ans (Hommes : 28, Femmes : 29.5) |
| PIB par habitant (PPA) | $6 834 (2022) |
| Codes Téléphone | 23, 234 |
| Voisinages | Karanganyar, Indramayu Sub-District, Jatibarang, Lemahmekar, Indramayu Sub-District, Margadadi, Indramayu Sub-District, Patrol |
| Heure locale | |
| Fuseau horaire | heure de l’Ouest indonésien |
| Lat. et long. | -6.32639, 108.32000 |
| Codes Postaux | 45211, 45212, 45213, 45214, 45215, More |
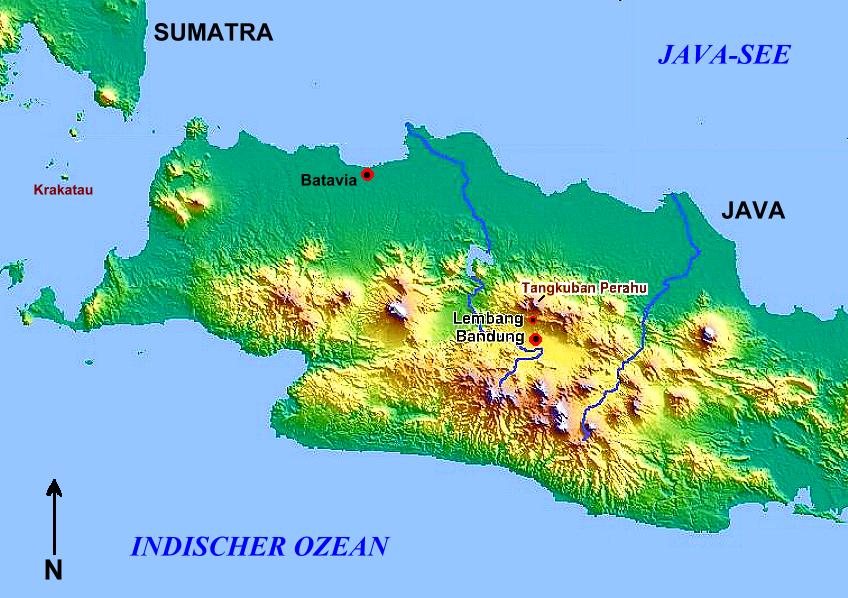
Carte de Indramayu
Carte interactive
Population de Indramayu
Années 1975 à 2030
| Data | 1975 | 1990 | 2000 | 2015 | 2020 | 2025* | 2030* |
|---|---|---|---|---|---|---|---|
| Population | 580 528 | 749 451 | 807 256 | 830 304 | 939 100 | 959 762 | 980 146 |
| Densité de population | 1 084,6 / km² | 1 400,2 / km² | 1 508,2 / km² | 1 551,2 / km² | 1 754,5 / km² | 1 793,1 / km² | 1 831,2 / km² |
Variation de la population de Indramayu de 2000 à 2020
Augmentation de 16.3% de l'année 2000 à 2020
| Lieu | Variation depuis 1975 | Variation depuis 1990 | Variation depuis 2000 |
|---|---|---|---|
| Indramayu | +61.8% | +25.3% | +16.3% |
| Java occidental | — | — | — |
| Indonésie | — | — | — |
Âge médian de Indramayu
Âge médian : 28.7 ans
| Lieu | Age moyen | Âge médian (femme) | Âge médian (masculin) |
|---|---|---|---|
| Indramayu | 28.7 yrs | 29.5 yrs | 28 yrs |
| Java occidental | 26.2 yrs | 26.2 yrs | 26.2 yrs |
| Indonésie | 27.2 yrs | 27.5 yrs | 26.9 yrs |
Densité de population de Indramayu
Densité de population : 1 755 / km²
| Lieu | Population | Région | Densité |
|---|---|---|---|
| Indramayu | 939 100 | 535,3 km² | 1 755 / km² |
| Java occidental | 44 507 | 53,6 km² | 831 / km² |
| Indonésie | 252,8 million | 1 893 657,8 km² | 134 / km² |
Population historique et projetée de Indramayu
Population estimée de 1400 à 2100
- JRC (European Commission's Joint Research Centre) travailler sur GHS built-up grid
- CIESIN (Center for International Earth Science Information Network)
- [Lien] Klein Goldewijk, K., Beusen, A., Doelman, J., and Stehfest, E.: Anthropogenic land use estimates for the Holocene – HYDE 3.2, Earth Syst. Sci. Data, 9, 927–953, https://doi.org/10.5194/essd-9-927-2017, 2017.
Quartiers à Indramayu
Pourcentage d'entreprises par quartier à Indramayu
Codes Téléphone
Pourcentage des indicatifs régionaux utilisés par les entreprises de Indramayu
Codes Postaux
Pourcentage d'entreprises par code postal à Indramayu
Distribution des prix
Répartition des activités par prix pour Indramayu
Indice de développement humain (IDH)
Indice composite statistique de l'espérance de vie, de l'éducation et du revenu par habitant.
Produit intérieur brut (PIB) de Indramayu
PIB par habitant, PPA (dollars internationaux constants de 2017)
| Data | 1990 | 1995 | 2000 | 2005 | 2010 | 2015 | 2020 | 2022 |
|---|---|---|---|---|---|---|---|---|
| PIB par habitant | $3 220 | $4 481 | $4 162 | $4 245 | $4 084 | $5 707 | $7 725 | $6 834 |
| PIB total | $1,5 Md | $2,3 Md | $2,2 Md | $2,3 Md | $2,2 Md | $3,2 Md | $4,5 Md | $4 Md |
Émissions de CO2 de Indramayu
Émissions de dioxyde de carbone (CO2) par habitant en tonnes par an
| Lieu | Emissions de CO2 | Émissions de CO2 par habitant | Intensité des émissions de CO2 |
|---|---|---|---|
| Indramayu | 1,654,277 tn | 1.76 tn | 3,090.7 tons/km² |
| Java occidental | 91,689 tn | 2.06 tn | 1,711.5 tons/km² |
| Indonésie | 478,610,416 tn | 1.89 tn | 252.7 tons/km² |
| Émissions de CO2 en 2013 (tonnes/an) | 1,654,277 tn |
| Émissions de CO2 en 2013 (tonnes/an) par habitant | 1.76 tn |
| Intensité des émissions de CO2 en 2013 (tonnes/km²/an) | 3,090.7 tons/km² |
Risque de dangers naturels
Risque relatif sur 10
| Danger | Niveau de risque |
|---|---|
| Sécheresse | Moyen (5) |
| Inonder | Élevé (10) |
| Tremblement de terre | Moyen (6.6) |
| Volcan | Moyen (5) |
* Les risques, en particulier concernant les inondations ou les glissements de terrain, peuvent ne pas concerner toute la zone.
- Dilley, M., R.S. Chen, U. Deichmann, A.L. Lerner-Lam, M. Arnold, J. Agwe, P. Buys, O. Kjekstad, B. Lyon, and G. Yetman. 2005. Natural Disaster Hotspots: A Global Risk Analysis. Washington, D.C.: World Bank. https://doi.org/10.1596/0-8213-5930-4.
- Center for Hazards and Risk Research - CHRR - Columbia University, Center for International Earth Science Information Network - CIESIN - Columbia University, and International Research Institute for Climate and Society - IRI - Columbia University. 2005. Global Drought Hazard Frequency and Distribution. Palisades, NY: NASA Socioeconomic Data and Applications Center (SEDAC). https://doi.org/10.7927/H4VX0DFT.
- Center for Hazards and Risk Research - CHRR - Columbia University, Center for International Earth Science Information Network - CIESIN - Columbia University. 2005. Global Flood Hazard Frequency and Distribution. Palisades, NY: NASA Socioeconomic Data and Applications Center (SEDAC). https://doi.org/10.7927/H4668B3D.
- Center for Hazards and Risk Research - CHRR - Columbia University, Center for International Earth Science Information Network - CIESIN - Columbia University. 2005. Global Volcano Hazard Frequency and Distribution. Palisades, NY: NASA Socioeconomic Data and Applications Center (SEDAC). https://doi.org/10.7927/H4BR8Q45.
- Center for Hazards and Risk Research - CHRR - Columbia University, Center for International Earth Science Information Network - CIESIN - Columbia University. 2005. Global Earthquake Hazard Distribution - Peak Ground Acceleration. Palisades, NY: NASA Socioeconomic Data and Applications Center (SEDAC). https://doi.org/10.7927/H4BZ63ZS.
Tremblements de terre récents à proximité
Magnitude 3.0 et plus
| Date▼ | Heure↕ | Magnitude↕ | Distance↕ | Profondeur↕ | Lieu↕ | Lien |
|---|---|---|---|---|---|---|
| 12/7/18 | 1:49 PM | 4.2 | 29 km | 265,170 m | 8km N of Arjawinangun, Indonesia | usgs.gov |
| 11/15/18 | 3:16 PM | 4 | 37 km | 312,100 m | 26km NNE of Masjid Jamie Baitul Muttaqien, Indonesia | usgs.gov |
| 8/21/18 | 9:23 PM | 4.3 | 73 km | 231,990 m | 7km E of Karangsembung, Indonesia | usgs.gov |
| 5/14/18 | 1:50 PM | 4 | 97.1 km | 275,980 m | 54km NE of Rengasdengklok, Indonesia | usgs.gov |
| 2/11/18 | 6:48 AM | 4 | 52 km | 242,260 m | 10km SSW of Palimanan, Indonesia | usgs.gov |
| 9/25/17 | 8:08 PM | 4.2 | 81.9 km | 306,630 m | 45km N of Pamanukan, Indonesia | usgs.gov |
| 7/31/16 | 10:46 AM | 4.2 | 62.7 km | 180,240 m | 11km NNE of Sumedang Utara, Indonesia | usgs.gov |
| 5/12/16 | 12:21 AM | 4.4 | 95.1 km | 171,670 m | 6km E of Bandung, Indonesia | usgs.gov |
| 1/25/16 | 12:54 PM | 4.2 | 39.3 km | 241,110 m | 13km NW of Jatiwangi, Indonesia | usgs.gov |
| 3/10/15 | 12:59 AM | 4 | 52 km | 284,750 m | 17km NNE of Pamanukan, Indonesia | usgs.gov |


À propos de nos données
Les données de cette page sont estimées à l'aide de divers outils et ressources accessibles au public. Elles sont fournies sans garantie et peuvent contenir des inexactitudes. Utilisez-les à vos risques et périls.