les industries
Répartition des entreprises par secteur à Labranzagrande
| Description de l'industrie | Nombre d'établissements |
|---|---|
| Restaurants | 11 |
| Épiceries et supermarchés | 11 |
Faits sur Labranzagrande
| Région | 516.1 km² |
| Population | 4 348 |
| Population masculine | 2 172 (50.0%) |
| Population féminine | 2 176 (50.0%) |
| Variation de la population (1975 to 2020) | -8.7% |
| Variation de la population (2000 to 2020) | -21.3% |
| Age moyen | 25.3 ans (Hommes : 24.4, Femmes : 26.2) |
| PIB par habitant (PPA) | $10 030 (2022) |
| Heure locale | |
| Fuseau horaire | heure normale de Colombie |
| Lat. et long. | 5.56223, -72.57499 |
| Codes Postaux | 151840, 151847 |
Carte de Labranzagrande
Carte interactive
Population de Labranzagrande
Années 1975 à 2030
| Data | 1975 | 1990 | 2000 | 2015 | 2020 | 2025* | 2030* |
|---|---|---|---|---|---|---|---|
| Population | 4 764 | 5 519 | 5 522 | 4 884 | 4 348 | 3 977 | 3 567 |
| Densité de population | 9,2 / km² | 10,7 / km² | 10,7 / km² | 9,5 / km² | 8,4 / km² | 7,7 / km² | 6,9 / km² |
Variation de la population de Labranzagrande de 2000 à 2020
Diminution de 21.3% de l'année 2000 à 2020
| Lieu | Variation depuis 1975 | Variation depuis 1990 | Variation depuis 2000 |
|---|---|---|---|
| Labranzagrande | -8.7% | -21.2% | -21.3% |
| Boyacá | — | — | — |
| Colombie | — | — | — |
Âge médian de Labranzagrande
Âge médian : 25.3 ans
| Lieu | Age moyen | Âge médian (femme) | Âge médian (masculin) |
|---|---|---|---|
| Labranzagrande | 25.3 yrs | 26.2 yrs | 24.4 yrs |
| Boyacá | 25.4 yrs | 26.3 yrs | 24.5 yrs |
| Colombie | 24.9 yrs | 25.8 yrs | 24.1 yrs |
Densité de population de Labranzagrande
Densité de population : 8,4 / km²
| Lieu | Population | Région | Densité |
|---|---|---|---|
| Labranzagrande | 4 348 | 516,1 km² | 8,4 / km² |
| Boyacá | 1,2 million | 23 199,7 km² | 52,4 / km² |
| Colombie | 47,8 million | 1 136 620,4 km² | 42,1 / km² |
Population historique et projetée de Labranzagrande
Population estimée de 0 à 2100
- JRC (European Commission's Joint Research Centre) travailler sur GHS built-up grid
- CIESIN (Center for International Earth Science Information Network)
- [Lien] Klein Goldewijk, K., Beusen, A., Doelman, J., and Stehfest, E.: Anthropogenic land use estimates for the Holocene – HYDE 3.2, Earth Syst. Sci. Data, 9, 927–953, https://doi.org/10.5194/essd-9-927-2017, 2017.
Indice de développement humain (IDH)
Indice composite statistique de l'espérance de vie, de l'éducation et du revenu par habitant.
Produit intérieur brut (PIB) de Labranzagrande
PIB par habitant, PPA (dollars internationaux constants de 2017)
| Data | 1990 | 1995 | 2000 | 2005 | 2010 | 2015 | 2020 | 2022 |
|---|---|---|---|---|---|---|---|---|
| PIB par habitant | $3 545 | $4 519 | $4 201 | $7 938 | $8 334 | $7 050 | $9 080 | $10 030 |
| PIB total | $18,8 M | $24,7 M | $23,1 M | $42,3 M | $41,9 M | $32,4 M | $40,2 M | $42,9 M |
Émissions de CO2 de Labranzagrande
Émissions de dioxyde de carbone (CO2) par habitant en tonnes par an
| Lieu | Emissions de CO2 | Émissions de CO2 par habitant | Intensité des émissions de CO2 |
|---|---|---|---|
| Labranzagrande | 11,399 tn | 2.62 tn | 22.1 tons/km² |
| Boyacá | 3,192,155 tn | 2.62 tn | 137.6 tons/km² |
| Colombie | 116,035,326 tn | 2.43 tn | 102.1 tons/km² |
| Émissions de CO2 en 2013 (tonnes/an) | 11,399 tn |
| Émissions de CO2 en 2013 (tonnes/an) par habitant | 2.62 tn |
| Intensité des émissions de CO2 en 2013 (tonnes/km²/an) | 22.1 tons/km² |
Risque de dangers naturels
Risque relatif sur 10
| Danger | Niveau de risque |
|---|---|
| Inonder | Élevé (9) |
| Tremblement de terre | Moyen (7) |
| Glissement de terrain | Élevé (8) |
* Les risques, en particulier concernant les inondations ou les glissements de terrain, peuvent ne pas concerner toute la zone.
- Dilley, M., R.S. Chen, U. Deichmann, A.L. Lerner-Lam, M. Arnold, J. Agwe, P. Buys, O. Kjekstad, B. Lyon, and G. Yetman. 2005. Natural Disaster Hotspots: A Global Risk Analysis. Washington, D.C.: World Bank. https://doi.org/10.1596/0-8213-5930-4.
- Center for Hazards and Risk Research - CHRR - Columbia University, Center for International Earth Science Information Network - CIESIN - Columbia University, and Norwegian Geotechnical Institute - NGI. 2005. Global Landslide Hazard Distribution. Palisades, NY: NASA Socioeconomic Data and Applications Center (SEDAC). https://doi.org/10.7927/H4P848VZ.
- Center for Hazards and Risk Research - CHRR - Columbia University, Center for International Earth Science Information Network - CIESIN - Columbia University. 2005. Global Flood Hazard Frequency and Distribution. Palisades, NY: NASA Socioeconomic Data and Applications Center (SEDAC). https://doi.org/10.7927/H4668B3D.
- Center for Hazards and Risk Research - CHRR - Columbia University, Center for International Earth Science Information Network - CIESIN - Columbia University. 2005. Global Earthquake Hazard Distribution - Peak Ground Acceleration. Palisades, NY: NASA Socioeconomic Data and Applications Center (SEDAC). https://doi.org/10.7927/H4BZ63ZS.
Tremblements de terre récents à proximité
Magnitude 3.0 et plus
| Date▼ | Heure↕ | Magnitude↕ | Distance↕ | Profondeur↕ | Lieu↕ | Lien |
|---|---|---|---|---|---|---|
| 7/14/19 | 4:21 PM | 4.3 | 84.2 km | 175,580 m | 25km WNW of Cerinza, Colombia | usgs.gov |
| 3/9/19 | 11:33 PM | 4.4 | 83.2 km | 10,000 m | 12km N of Sabanalarga, Colombia | usgs.gov |
| 12/13/18 | 9:28 AM | 4.8 | 79.2 km | 10,000 m | 9km S of Paez, Colombia | usgs.gov |
| 11/9/18 | 11:11 AM | 4.3 | 97.6 km | 190,130 m | 3km NE of Tipacoque, Colombia | usgs.gov |
| 10/25/18 | 5:25 AM | 4.4 | 48.1 km | 47,890 m | 6km SW of Aguazul, Colombia | usgs.gov |
| 3/16/17 | 3:38 PM | 5.2 | 74.1 km | 17,470 m | 17km NNW of Ubala, Colombia | usgs.gov |
| 1/8/16 | 2:55 PM | 4.5 | 33.1 km | 35,000 m | 11km NNE of Aguazul, Colombia | usgs.gov |
| 8/10/15 | 4:59 PM | 4.4 | 30.1 km | 10,000 m | 13km N of Aguazul, Colombia | usgs.gov |
| 5/16/15 | 9:00 AM | 4.4 | 39.7 km | 10,000 m | 8km SSW of Aquitania, Colombia | usgs.gov |
| 3/11/14 | 1:57 PM | 4.7 | 42.5 km | 10,000 m | 11km WSW of Pajarito, Colombia | usgs.gov |
Labranzagrande
Labranzagrande est une municipalité située dans le département de Boyacá, en Colombie.
Page Wikipédia de Labranzagrande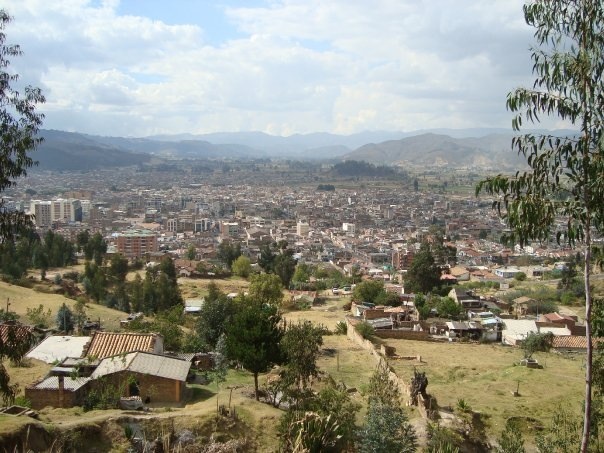

À propos de nos données
Les données de cette page sont estimées à l'aide de divers outils et ressources accessibles au public. Elles sont fournies sans garantie et peuvent contenir des inexactitudes. Utilisez-les à vos risques et périls.