Faits sur Gamarra
| Région | 267.6 km² |
| Population | 18 218 |
| Population masculine | 9 103 (50.0%) |
| Population féminine | 9 115 (50.0%) |
| Variation de la population (1975 to 2020) | +188.4% |
| Variation de la population (2000 to 2020) | +37.0% |
| Age moyen | 21 ans (Hommes : 20.4, Femmes : 21.7) |
| Heure locale | |
| Fuseau horaire | heure normale de Colombie |
| Lat. et long. | 8.32279, -73.74268 |
| Codes Postaux | 205001, 205007, 205008 |
Carte de Gamarra
Carte interactive
Population de Gamarra
Années 1975 à 2020
| Data | 1975 | 1990 | 2000 | 2015 | 2020 |
|---|---|---|---|---|---|
| Population | 6 317 | 10 442 | 13 294 | 17 091 | 18 218 |
| Densité de population | 23,6 / km² | 39 / km² | 49,7 / km² | 63,9 / km² | 68,1 / km² |
Variation de la population de Gamarra de 2000 à 2015
Augmentation de 28.6% de l'année 2000 à 2015
| Lieu | Variation depuis 1975 | Variation depuis 1990 | Variation depuis 2000 |
|---|---|---|---|
| Gamarra | +170.6% | +63.7% | +28.6% |
| Cesar (département colombien) | +65.5% | +27.1% | +12.1% |
| Colombie | +94.6% | +40.7% | +19.4% |
Âge médian de Gamarra
Âge médian : 21 ans
| Lieu | Age moyen | Âge médian (femme) | Âge médian (masculin) |
|---|---|---|---|
| Gamarra | 21 yrs | 21.7 yrs | 20.4 yrs |
| Cesar (département colombien) | 21 yrs | 21.7 yrs | 20.4 yrs |
| Colombie | 24.9 yrs | 25.8 yrs | 24.1 yrs |
Densité de population de Gamarra
Densité de population : 68,1 / km²
| Lieu | Population | Région | Densité |
|---|---|---|---|
| Gamarra | 18 218 | 267,6 km² | 68,1 / km² |
| Cesar (département colombien) | 961 150 | 22 641,7 km² | 42,5 / km² |
| Colombie | 47,8 million | 1 136 620,4 km² | 42,1 / km² |
Population historique et projetée de Gamarra
Population estimée de 0 à 2100
- JRC (European Commission's Joint Research Centre) travailler sur GHS built-up grid
- CIESIN (Center for International Earth Science Information Network)
- [Lien] Klein Goldewijk, K., Beusen, A., Doelman, J., and Stehfest, E.: Anthropogenic land use estimates for the Holocene – HYDE 3.2, Earth Syst. Sci. Data, 9, 927–953, https://doi.org/10.5194/essd-9-927-2017, 2017.
Distribution des prix
Répartition des activités par prix pour Gamarra
Indice de développement humain (IDH)
Indice composite statistique de l'espérance de vie, de l'éducation et du revenu par habitant.
Émissions de CO2 de Gamarra
Émissions de dioxyde de carbone (CO2) par habitant en tonnes par an
| Lieu | Emissions de CO2 | Émissions de CO2 par habitant | Intensité des émissions de CO2 |
|---|---|---|---|
| Gamarra | 44,767 tn | 2.46 tn | 167.3 tons/km² |
| Cesar (département colombien) | 2,397,025 tn | 2.49 tn | 105.9 tons/km² |
| Colombie | 116,035,326 tn | 2.43 tn | 102.1 tons/km² |
| Émissions de CO2 en 2013 (tonnes/an) | 44,767 tn |
| Émissions de CO2 en 2013 (tonnes/an) par habitant | 2.46 tn |
| Intensité des émissions de CO2 en 2013 (tonnes/km²/an) | 167.3 tons/km² |
Risque de dangers naturels
Relative risk out of 10
| Danger | Risk Level |
|---|---|
| Flood | High (10) |
| Earthquake | Medium (6) |
| Landslide | Medium (6) |
* Risk, particularly concerning flood or landslide, may not be for the entire area.
- Dilley, M., R.S. Chen, U. Deichmann, A.L. Lerner-Lam, M. Arnold, J. Agwe, P. Buys, O. Kjekstad, B. Lyon, and G. Yetman. 2005. Natural Disaster Hotspots: A Global Risk Analysis. Washington, D.C.: World Bank. https://doi.org/10.1596/0-8213-5930-4.
- Center for Hazards and Risk Research - CHRR - Columbia University, Center for International Earth Science Information Network - CIESIN - Columbia University, and Norwegian Geotechnical Institute - NGI. 2005. Global Landslide Hazard Distribution. Palisades, NY: NASA Socioeconomic Data and Applications Center (SEDAC). https://doi.org/10.7927/H4P848VZ.
- Center for Hazards and Risk Research - CHRR - Columbia University, Center for International Earth Science Information Network - CIESIN - Columbia University. 2005. Global Flood Hazard Frequency and Distribution. Palisades, NY: NASA Socioeconomic Data and Applications Center (SEDAC). https://doi.org/10.7927/H4668B3D.
- Center for Hazards and Risk Research - CHRR - Columbia University, Center for International Earth Science Information Network - CIESIN - Columbia University. 2005. Global Earthquake Hazard Distribution - Peak Ground Acceleration. Palisades, NY: NASA Socioeconomic Data and Applications Center (SEDAC). https://doi.org/10.7927/H4BZ63ZS.
Tremblements de terre récents à proximité
Magnitude 3.0 et plus
| Date▼ | Heure↕ | Magnitude↕ | Distance↕ | Profondeur↕ | Lieu↕ | Lien |
|---|---|---|---|---|---|---|
| 6/24/19 | 12:30 AM | 4.4 | 66.4 km | 126,400 m | 31km NNE of El Carmen, Colombia | usgs.gov |
| 1/10/19 | 2:04 AM | 4.6 | 46.7 km | 128,949 m | 9km NNE of Gonzalez, Colombia | usgs.gov |
| 8/5/18 | 11:04 AM | 4.3 | 82.3 km | 215,340 m | 30km NW of Sabana de Torres, Colombia | usgs.gov |
| 6/19/17 | 4:13 PM | 4.4 | 33.2 km | 159,430 m | 5km WSW of El Carmen, Colombia | usgs.gov |
| 4/7/17 | 12:54 AM | 4.2 | 84.7 km | 118,580 m | 16km E of San Alberto, Colombia | usgs.gov |
| 11/24/16 | 8:37 AM | 4.4 | 99.7 km | 153,020 m | 11km NW of El Playon, Colombia | usgs.gov |
| 10/14/15 | 7:47 AM | 5 | 88.6 km | 125,680 m | 15km SE of San Alberto, Colombia | usgs.gov |
| 6/13/14 | 11:32 PM | 4.4 | 85.7 km | 52,170 m | 18km E of San Alberto, Colombia | usgs.gov |
| 6/7/14 | 8:24 AM | 4.2 | 90.5 km | 133,800 m | 19km ESE of San Alberto, Colombia | usgs.gov |
| 3/24/14 | 8:28 PM | 4.5 | 78.3 km | 76,710 m | 3km SE of Montecristo, Colombia | usgs.gov |
Gamarra
Gamarra est une municipalité située dans le département de Cesar, en Colombie. possède un aéroport (code AITA : GRA).
Page Wikipédia de Gamarra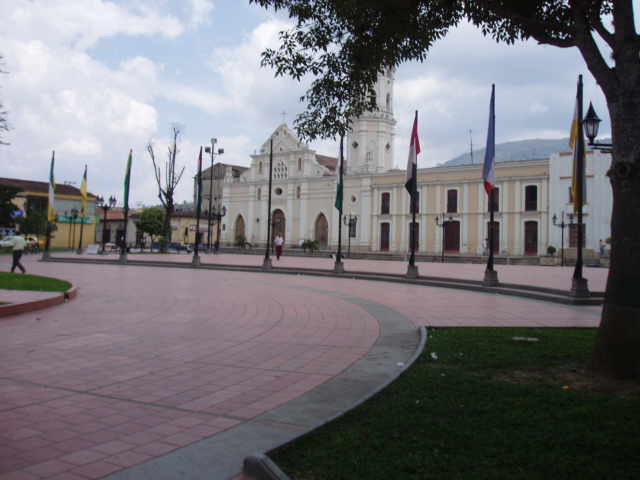


À propos de nos données
Les données de cette page sont estimées à l'aide de divers outils et ressources accessibles au public. Elles sont fournies sans garantie et peuvent contenir des inexactitudes. Utilisez-les à vos risques et périls.