Catégories à Curicó
les industries
Répartition des entreprises par secteur à Curicó
| Description de l'industrie | Nombre d'établissements |
|---|---|
| Construction de bâtiments | 194 |
| Shopping | 189 |
| Restaurants | 154 |
| Épiceries et supermarchés | 93 |
| Réparations de voitures | 78 |
Faits sur Curicó
| Région | 93.6 km² |
| Population | 136 042 |
| Population masculine | 66 983 (49.2%) |
| Population féminine | 69 059 (50.8%) |
| Variation de la population (1975 to 2020) | +125.9% |
| Variation de la population (2000 to 2020) | +22.0% |
| Age moyen | 32 ans (Hommes : 31.2, Femmes : 32.8) |
| PIB par habitant (PPA) | $17 872 (2022) |
| Codes Téléphone | 75 |
| Voisinages | A, B, B Curico, C, DP A |
| Heure locale | |
| Fuseau horaire | heure normale du Chili |
| Lat. et long. | -34.98279, -71.23943 |
| Codes Postaux | 3340000 |
Carte de Curicó
Carte interactive
Population de Curicó
Années 1975 à 2030
| Data | 1975 | 1990 | 2000 | 2015 | 2020 | 2025* | 2030* |
|---|---|---|---|---|---|---|---|
| Population | 60 216 | 92 784 | 111 534 | 134 450 | 136 042 | 138 772 | 138 834 |
| Densité de population | 643,2 / km² | 991 / km² | 1 191,3 / km² | 1 436 / km² | 1 453,1 / km² | 1 482,2 / km² | 1 482,9 / km² |
Variation de la population de Curicó de 2000 à 2020
Augmentation de 22% de l'année 2000 à 2020
| Lieu | Variation depuis 1975 | Variation depuis 1990 | Variation depuis 2000 |
|---|---|---|---|
| Curicó | +125.9% | +46.6% | +22% |
| Région du Maule | — | — | — |
| Chili | — | — | — |
Âge médian de Curicó
Âge médian : 32 ans
| Lieu | Age moyen | Âge médian (femme) | Âge médian (masculin) |
|---|---|---|---|
| Curicó | 32 yrs | 32.8 yrs | 31.2 yrs |
| Région du Maule | 32.1 yrs | 32.6 yrs | 31.6 yrs |
| Chili | 31.3 yrs | 32 yrs | 30.6 yrs |
Densité de population de Curicó
Densité de population : 1 453 / km²
| Lieu | Population | Région | Densité |
|---|---|---|---|
| Curicó | 136 042 | 93,6 km² | 1 453 / km² |
| Région du Maule | 1 million | 30 309,7 km² | 33,9 / km² |
| Chili | 17,8 million | 751 744,8 km² | 23,7 / km² |
Population historique et projetée de Curicó
Population estimée de 1790 à 2100
- JRC (European Commission's Joint Research Centre) travailler sur GHS built-up grid
- CIESIN (Center for International Earth Science Information Network)
- [Lien] Klein Goldewijk, K., Beusen, A., Doelman, J., and Stehfest, E.: Anthropogenic land use estimates for the Holocene – HYDE 3.2, Earth Syst. Sci. Data, 9, 927–953, https://doi.org/10.5194/essd-9-927-2017, 2017.
Quartiers à Curicó
Pourcentage d'entreprises par quartier à Curicó
Distribution des prix
Répartition des activités par prix pour Curicó
Indice de développement humain (IDH)
Indice composite statistique de l'espérance de vie, de l'éducation et du revenu par habitant.
Produit intérieur brut (PIB) de Curicó
PIB par habitant, PPA (dollars internationaux constants de 2017)
| Data | 1990 | 1995 | 2000 | 2005 | 2010 | 2015 | 2020 | 2022 |
|---|---|---|---|---|---|---|---|---|
| PIB par habitant | $7 754 | $10 035 | $11 117 | $14 684 | $15 352 | $15 726 | $17 152 | $17 872 |
| PIB total | $99 M | $140,4 M | $165,3 M | $250,9 M | $302,7 M | $346,8 M | $415,2 M | $436,9 M |
Émissions de CO2 de Curicó
Émissions de dioxyde de carbone (CO2) par habitant en tonnes par an
| Lieu | Emissions de CO2 | Émissions de CO2 par habitant | Intensité des émissions de CO2 |
|---|---|---|---|
| Curicó | 645,241 tn | 4.74 tn | 6,891.8 tons/km² |
| Région du Maule | 4,565,743 tn | 4.44 tn | 150.6 tons/km² |
| Chili | 87,296,657 tn | 4.91 tn | 116.1 tons/km² |
| Émissions de CO2 en 2013 (tonnes/an) | 645,241 tn |
| Émissions de CO2 en 2013 (tonnes/an) par habitant | 4.74 tn |
| Intensité des émissions de CO2 en 2013 (tonnes/km²/an) | 6,891.8 tons/km² |
Risque de dangers naturels
Risque relatif sur 10
| Danger | Niveau de risque |
|---|---|
| Sécheresse | Élevé (9.2) |
| Inonder | Élevé (10) |
| Tremblement de terre | Élevé (7.3) |
| Glissement de terrain | Élevé (9) |
| Volcan | Moyen (5) |
* Les risques, en particulier concernant les inondations ou les glissements de terrain, peuvent ne pas concerner toute la zone.
- Dilley, M., R.S. Chen, U. Deichmann, A.L. Lerner-Lam, M. Arnold, J. Agwe, P. Buys, O. Kjekstad, B. Lyon, and G. Yetman. 2005. Natural Disaster Hotspots: A Global Risk Analysis. Washington, D.C.: World Bank. https://doi.org/10.1596/0-8213-5930-4.
- Center for Hazards and Risk Research - CHRR - Columbia University, Center for International Earth Science Information Network - CIESIN - Columbia University, and Norwegian Geotechnical Institute - NGI. 2005. Global Landslide Hazard Distribution. Palisades, NY: NASA Socioeconomic Data and Applications Center (SEDAC). https://doi.org/10.7927/H4P848VZ.
- Center for Hazards and Risk Research - CHRR - Columbia University, Center for International Earth Science Information Network - CIESIN - Columbia University, and International Research Institute for Climate and Society - IRI - Columbia University. 2005. Global Drought Hazard Frequency and Distribution. Palisades, NY: NASA Socioeconomic Data and Applications Center (SEDAC). https://doi.org/10.7927/H4VX0DFT.
- Center for Hazards and Risk Research - CHRR - Columbia University, Center for International Earth Science Information Network - CIESIN - Columbia University. 2005. Global Flood Hazard Frequency and Distribution. Palisades, NY: NASA Socioeconomic Data and Applications Center (SEDAC). https://doi.org/10.7927/H4668B3D.
- Center for Hazards and Risk Research - CHRR - Columbia University, Center for International Earth Science Information Network - CIESIN - Columbia University. 2005. Global Volcano Hazard Frequency and Distribution. Palisades, NY: NASA Socioeconomic Data and Applications Center (SEDAC). https://doi.org/10.7927/H4BR8Q45.
- Center for Hazards and Risk Research - CHRR - Columbia University, Center for International Earth Science Information Network - CIESIN - Columbia University. 2005. Global Earthquake Hazard Distribution - Peak Ground Acceleration. Palisades, NY: NASA Socioeconomic Data and Applications Center (SEDAC). https://doi.org/10.7927/H4BZ63ZS.
Tremblements de terre récents à proximité
Magnitude 3.0 et plus
| Date▼ | Heure↕ | Magnitude↕ | Distance↕ | Profondeur↕ | Lieu↕ | Lien |
|---|---|---|---|---|---|---|
| 12/11/18 | 5:55 PM | 4.6 | 11 km | 96,010 m | 10km E of Curico, Chile | usgs.gov |
| 10/27/18 | 12:29 PM | 4.2 | 11.7 km | 97,960 m | 11km ESE of Curico, Chile | usgs.gov |
| 2/23/14 | 11:23 PM | 4.4 | 14.4 km | 16,400 m | 5km NW of Molina, Chile | usgs.gov |
| 9/24/12 | 2:50 AM | 4.2 | 10.2 km | 118,300 m | Maule, Chile | usgs.gov |
| 2/13/12 | 1:28 AM | 4.7 | 11.8 km | 89,700 m | Maule, Chile | usgs.gov |
| 2/2/12 | 7:07 AM | 4.5 | 9.7 km | 115,300 m | Maule, Chile | usgs.gov |
| 2/27/10 | 1:26 PM | 4.5 | 9.1 km | 35,000 m | Maule, Chile | usgs.gov |
| 11/14/08 | 4:20 PM | 3 | 9.8 km | 103,900 m | Maule, Chile | usgs.gov |
| 7/8/08 | 6:02 AM | 3.1 | 7.5 km | 89,500 m | Maule, Chile | usgs.gov |
| 7/3/08 | 7:35 PM | 4.2 | 10.7 km | 97,000 m | Maule, Chile | usgs.gov |
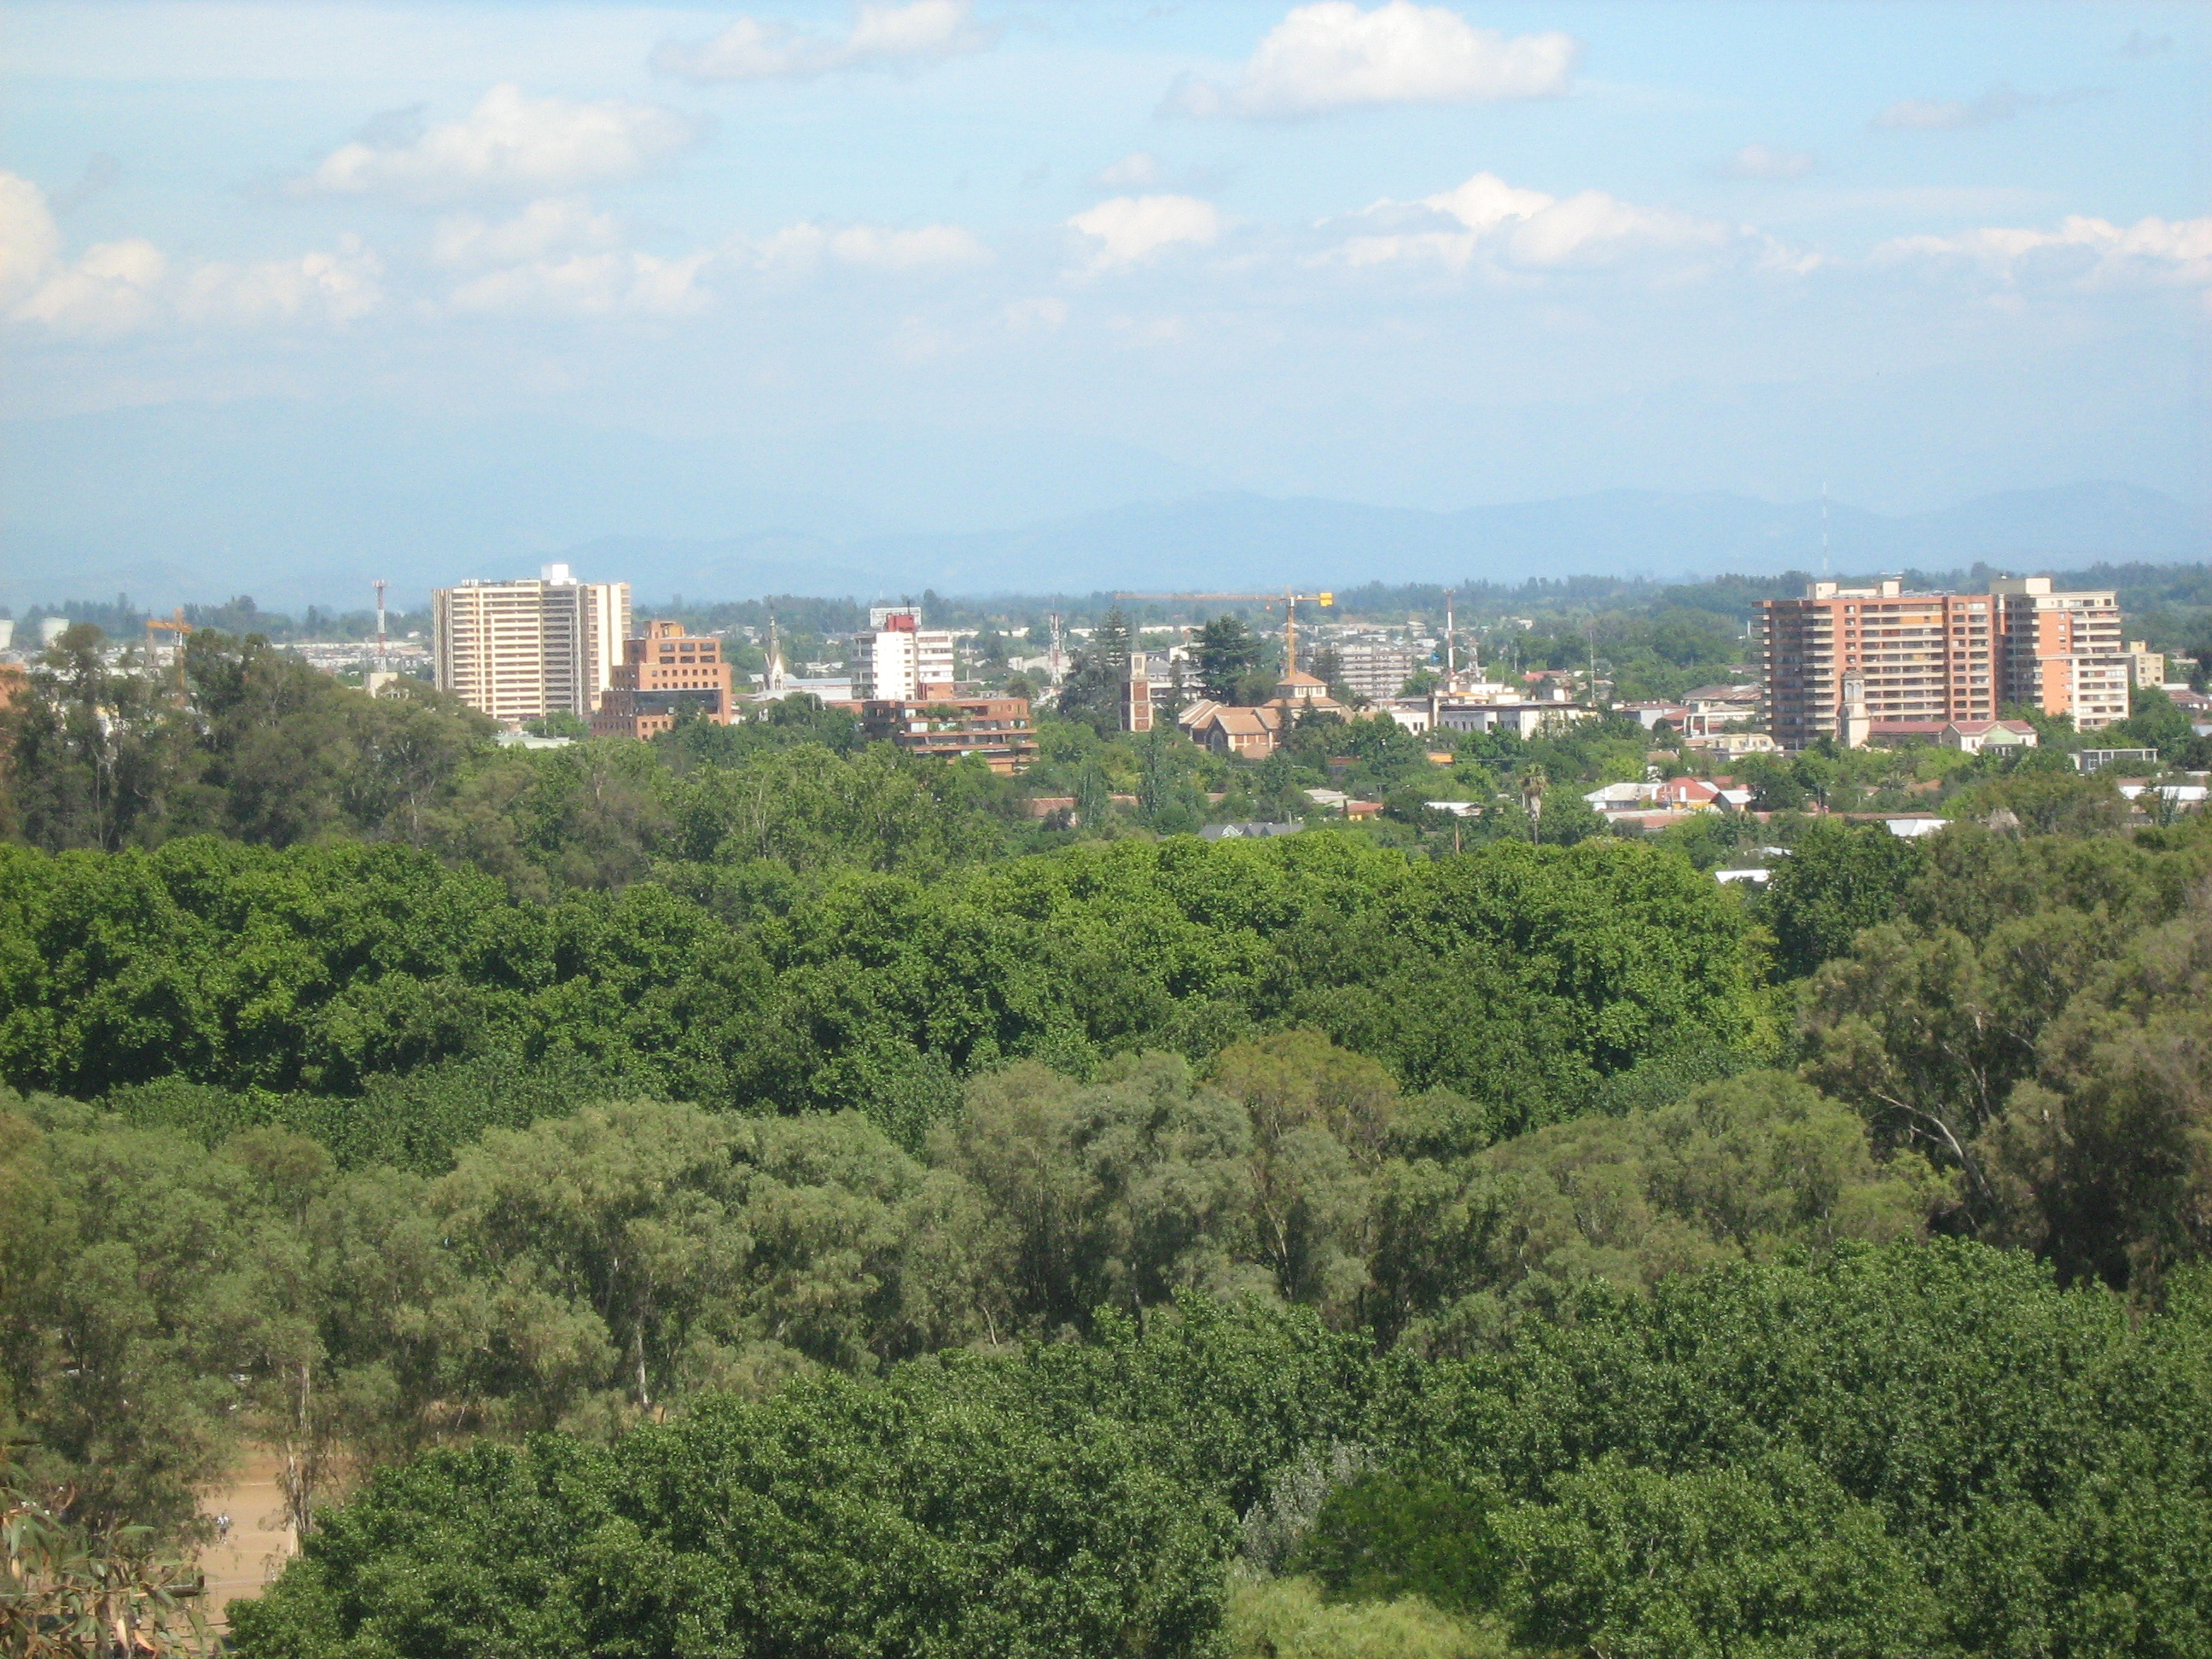
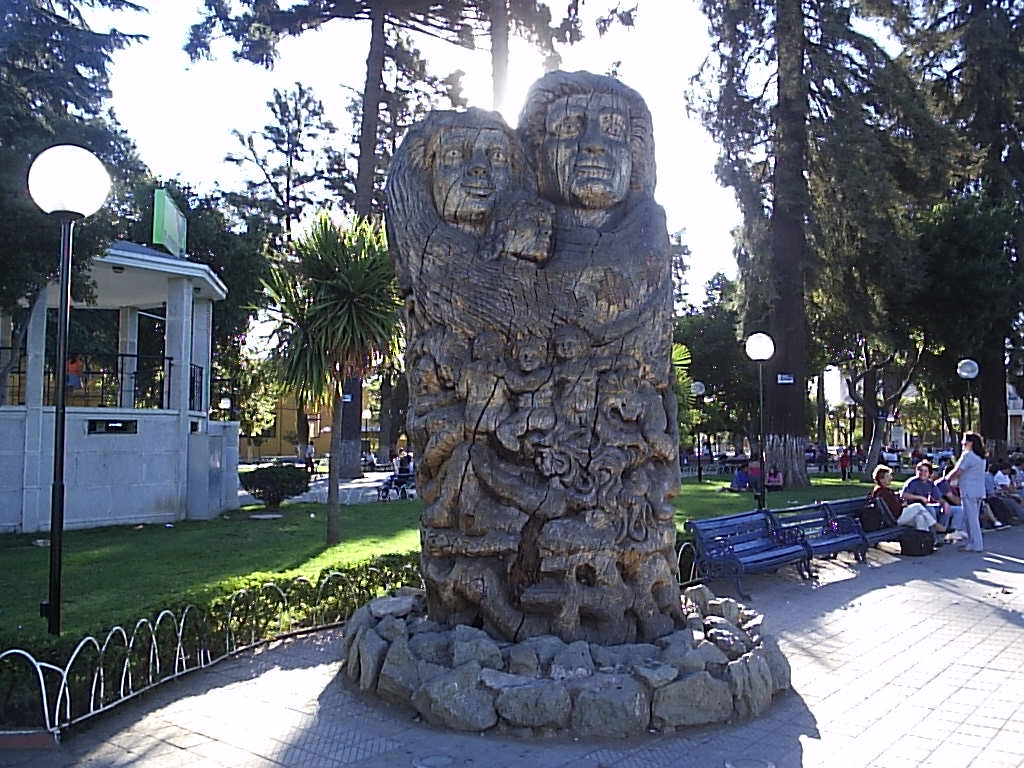
Curicó
Curicó est une commune et ville du Chili, chef-lieu de la province du même nom, dans la région du Maule. 2005 elle comptait 120 113 habitants.
Page Wikipédia de Curicó
À propos de nos données
Les données de cette page sont estimées à l'aide de divers outils et ressources accessibles au public. Elles sont fournies sans garantie et peuvent contenir des inexactitudes. Utilisez-les à vos risques et périls.